Importing Layer Symbology into ArcMap for Landscape Burn Probability outputs
IFTDSS uses a specific color scheme for Map Studio and report figures. When you download IFTDSS files for use in Arcmap, you can duplicate this color scheme using our .lyr files contained in the "symbology" folder. The .lyr file contains all the color specifications used by IFTDSS.
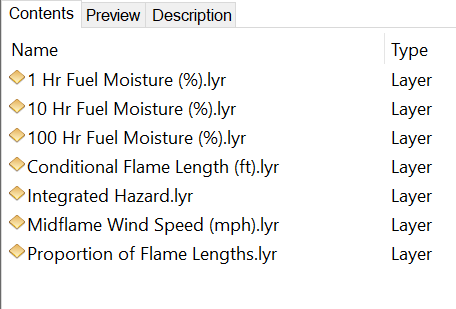
Lyr files in the Landscape Burn Probability package include:
- Conditional Flame Length (ft)
- Integrated Hazard
- Midflame Wind Speed (mph)
- Proportion of Flame Lengths
- 1-hr Fuel Moisture
- 10-hr Fuel Moisture
- 100-hr Fuel Moisture
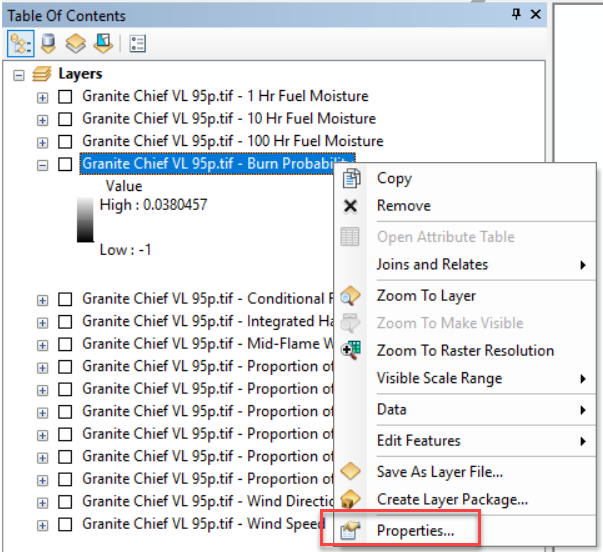
Important! Burn Probability is dynamic and varies by file, see the BP steps below for details and setting symbology for it.
Important! The symbology was designed to match the units in Map Studio; however, the units in GeoTIFF are not always the same. For example, 1 Hour Fuel Moisture is a proportion in the GeoTIFF, and percent in the legend. In the image below, the value for the pixel at the black dot is 0.027283. This is 2.7283 % and is in the >2 - 3 class in the legend (orange).
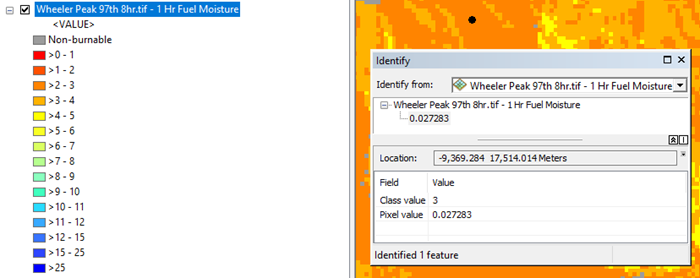
See the Landscape Burn Probability Outputs topic for the units in Map Studio versus the GeoTIFF.
In the Landscape Burn Probability (LBP) download package available in IFTDSS, we include a folder entitled "symbology." The symbology folder contains ArcGIS Layer (.lyr) files to define the symbology for most of the layers visible in Map Studio for use in ArcMap. In the GeoTIFF, the LBP layers are both categorical and continuous data, therefore importing the symbology is slightly different for the two types.
Although Burn Probability is visible in Map Studio, we have not included an ArcGIS Layer file because the bins are dynamically derived on the Analysis Maximum and it is not possible to create a file for individual model outputs. We have included the steps required to change the symbology within ArcMap manually.
Importing symbology for Integrated Hazard
The Integrated Hazard layer in the LBP GeoTIFF is categorical data. The following steps outline how to import the symbology for categorical data.
- Open an ArcMap session and add the layers you would like to map. For more information on how do add layers to ArcMap see the Opening an IFTDSS Geo Tiff file in ArcMap topic.
-
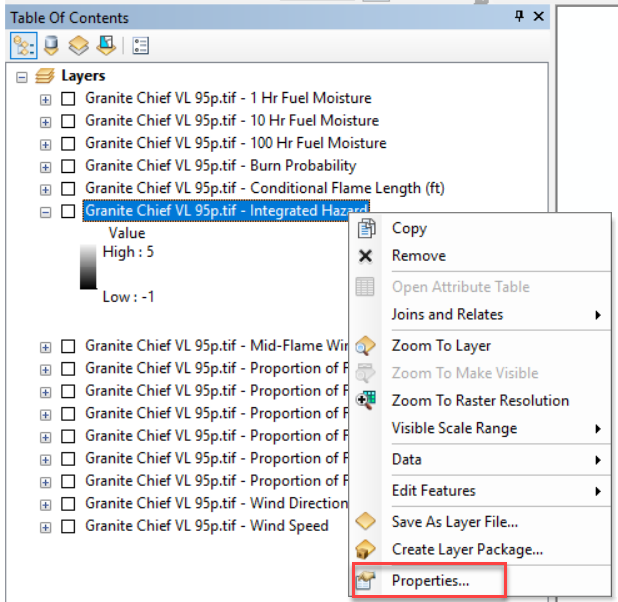
Right-click on the “Integrated Hazard” layer and click Properties.
-
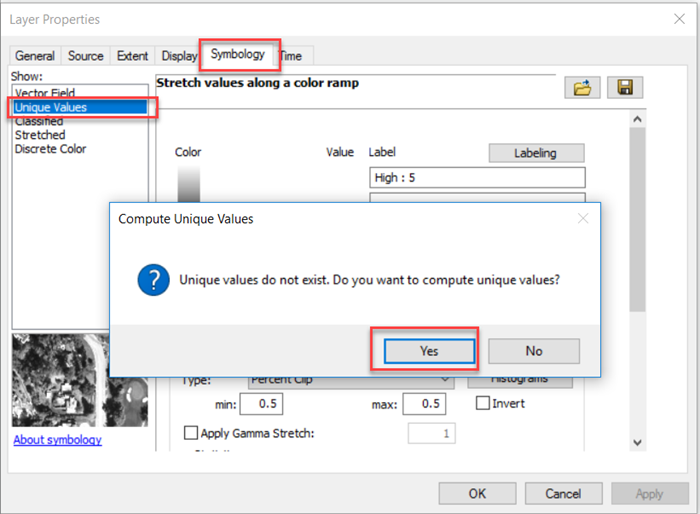
In the Layer Properties window go to the Symbology tab and select Unique Values. You may get a pop-up window asking if you would like to compute unique values. Click Yes.
-
Click the Folder icon
 toward the top right of the Layer Properties window. In the Import Symbology window that opens, click on the Folder icon . This opens the Browse window. Select the “Integrated Hazard.lyr” file in the Browse window and click Add.
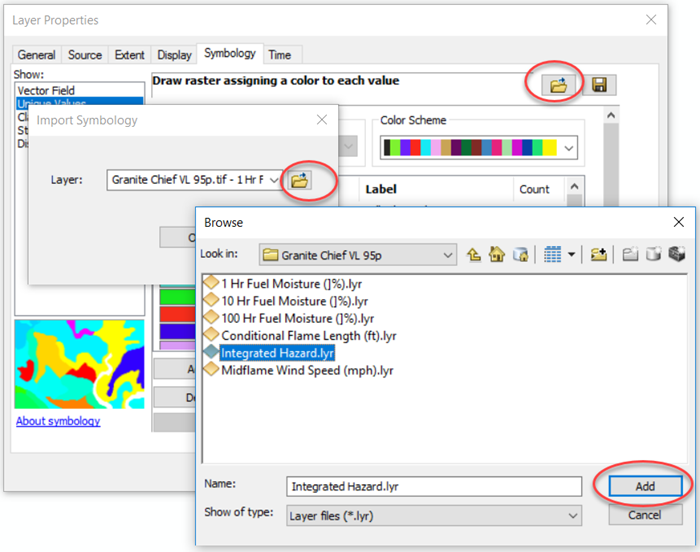
-
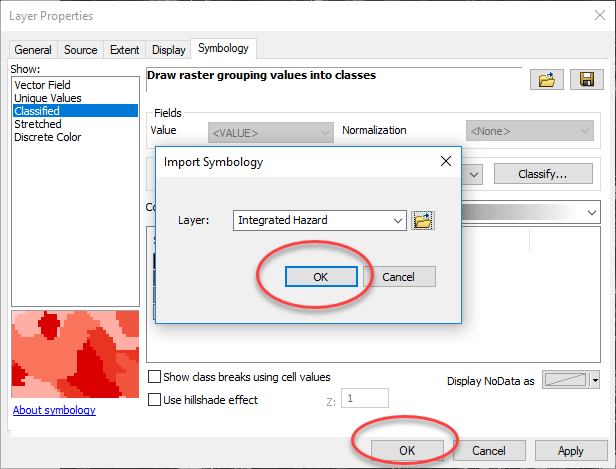
Click OK to close the Import Symbology window, and OK in the bottom of the Layer Properties window to apply the symbology.
-
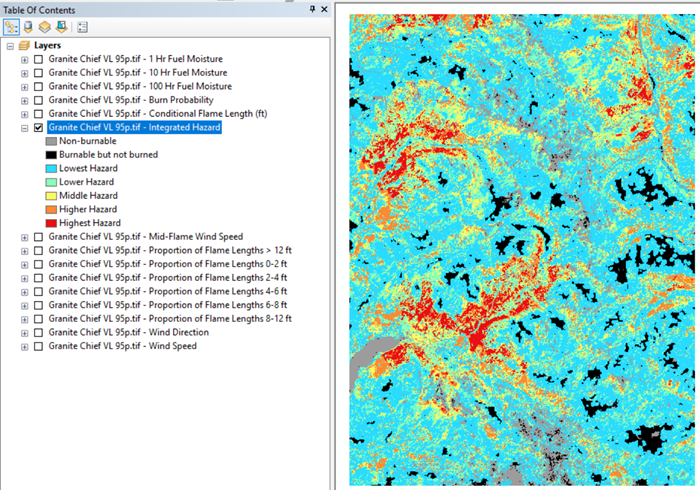
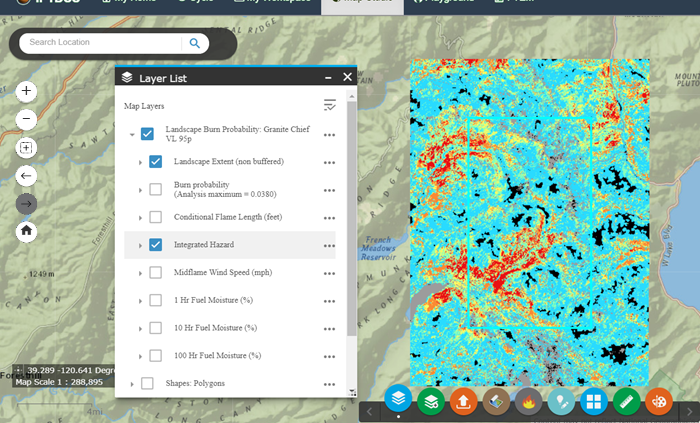
Now you can see the Integrated Hazard layer in ArcMap (top image) the same as it is in Map Studio in IFTDSS (bottom image).
Applying symbology for 1, 10, and 100 Hour Fuel Moisture, Conditional Flame Length, Midflame Wind Speed, and Proportion of Flame Lengths
The same steps are completed to import the symbology for 1, 10, and 100 Hour Fuel Moistures, Conditional Flame Length, Midflame Wind Speed, and Proportion of Flame Lengths. These data sources are continuous data that are classified into distinct bins. The following steps outline how to import the symbology for continuous data. The example below will use Conditional Flame Length; however, the same steps are applied to the remaining layers.
- Open an ArcMap session and add the layers you would like to map. For more information on how do add layers to ArcMap please see the Opening an IFTDSS Geo Tiff file in ArcMap help topic.
-
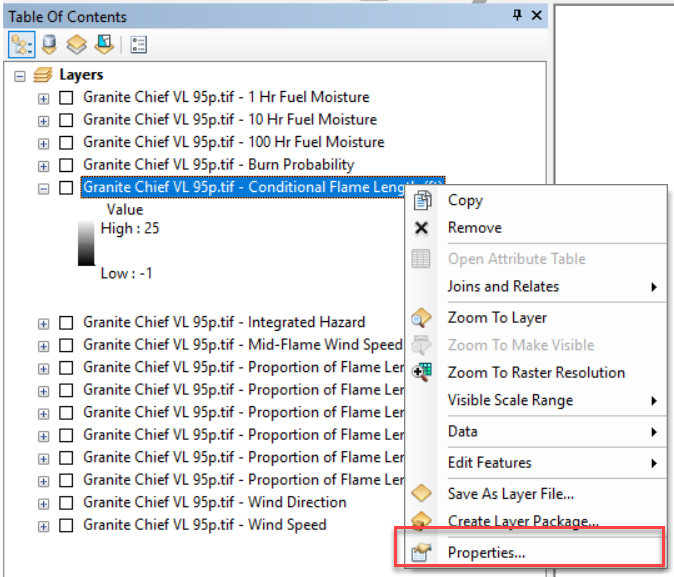
Right-click the “Conditional Flame Length” layer and click Properties.
-
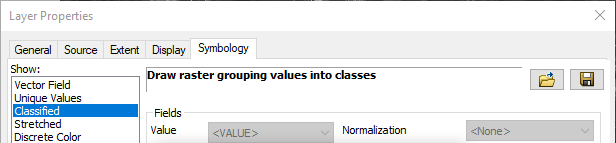
In the Layer Properties window go to the Symbology tab and select “Classified”.
-
Click on the Folder icon
toward the top right of the Layer Properties window. In the Import Symbology window that opens, click the Folder icon . This opens the Browse window. Select the “Conditional Flame Length (ft).lyr” file in the Browse window and click Add.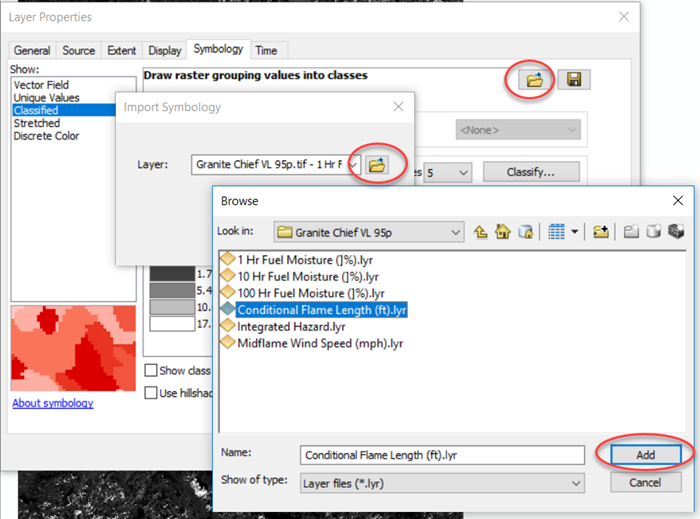
-
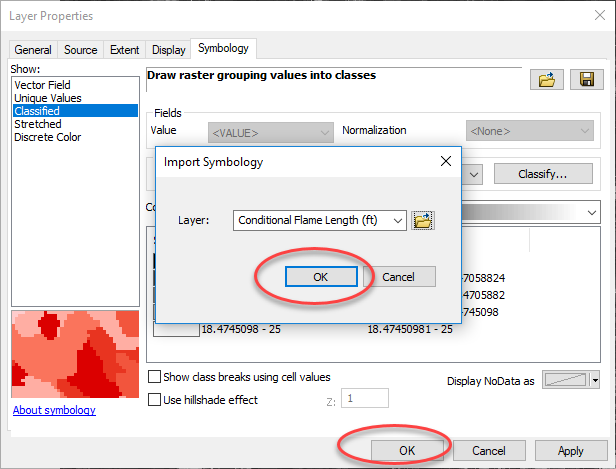
Click OK to close the Import Symbology window, and OK in the bottom of the Layer Property window to apply the symbology.
-
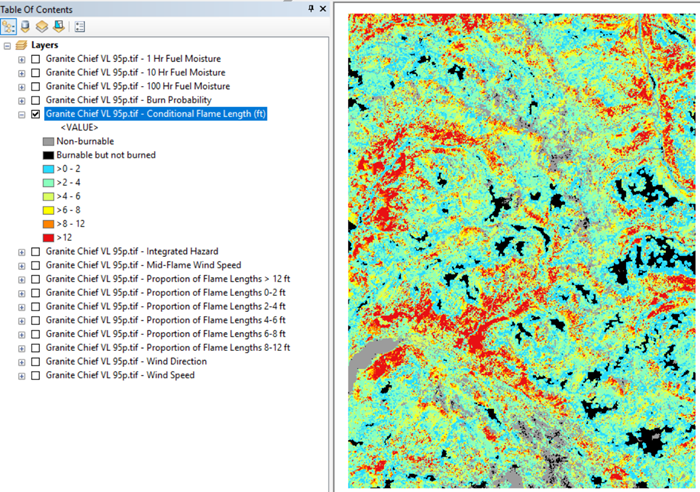
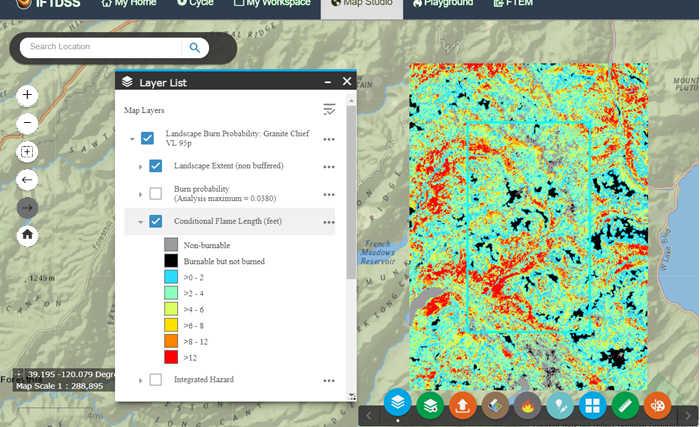
Now you can see Conditional Flame Length in ArcMap (top image) the same as it is in Map Studio in IFTDSS (bottom image).
Applying Symbology for Burn Probability
For Burn Probability, because the legend is dynamically applied to each model output based on the analysis maximum burn probability value there is not an ArcGIS Layer file included in the download package. The steps below walk-through the process of classifying your Burn Probability in Arcmap using the same break values used in IFTDSS, and setting the color ramp to the same values for those classifications.
- Open ArcMap session and add the layers you would like to map. For more information on how do add layers to ArcMap please see the Opening an IFTDSS Geo Tiff file in ArcMap topic.
Right-click on the "Burn Probability" layer and click Properties.
-
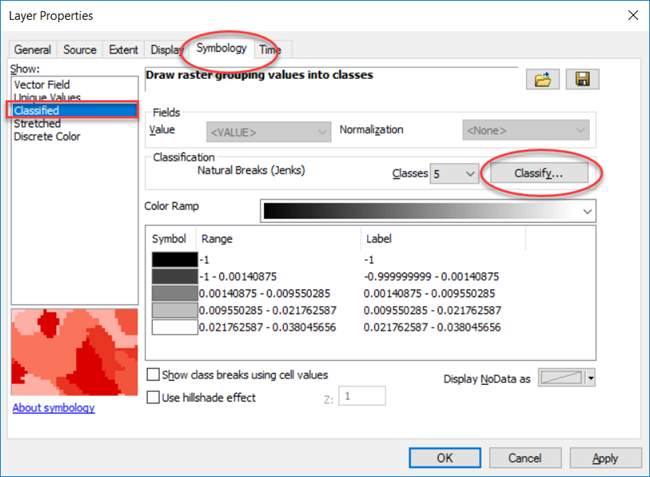
To determine the break values for the classification, in the Layer Property window, go to the Symbology tab, select "Classified", then click the Classify button.
-
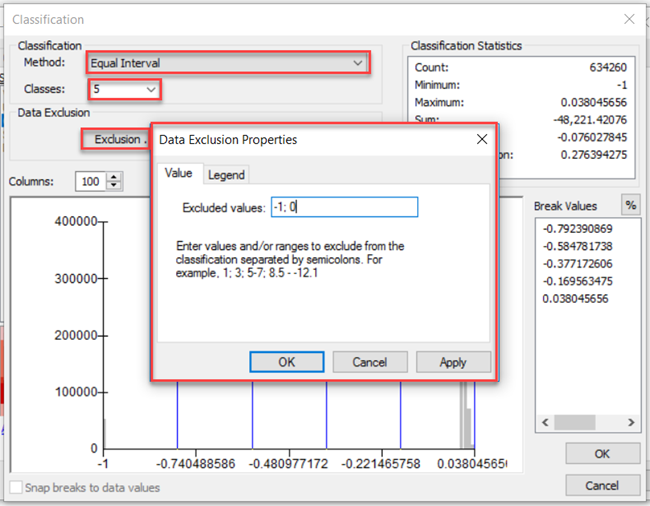
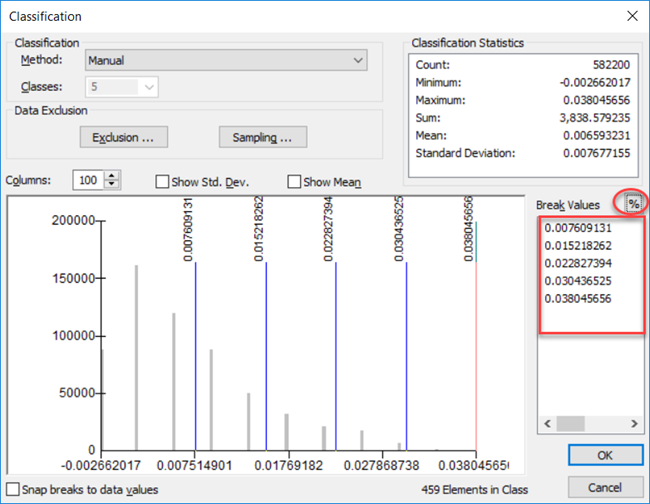
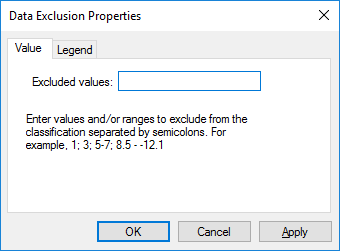
In the Classification window, change the Method to “Equal Interval” and the Classes to “5”. Click the Exclusion.. button. In the Data Exclusion Properties window, enter “-1;0” and click OK.
-
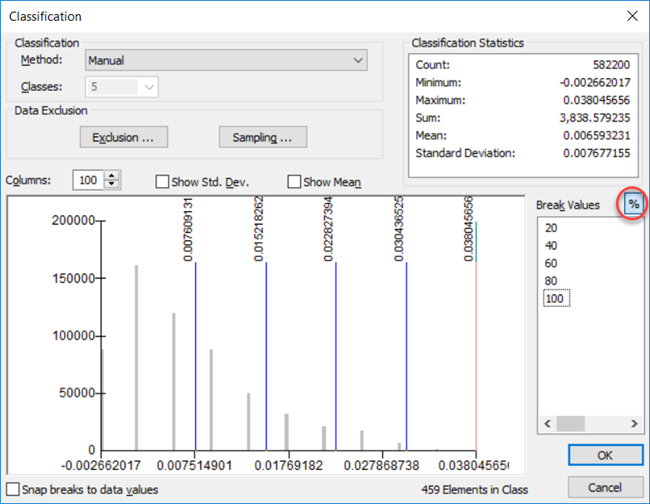
In the Classification window, click the % button to the right of the Break Values. Click each value and change the values to 20, 40, 60, 80, and 100 if they are not already set.
-
Click the % button again. The Break Values represent the 20% of maximum classes seen in Map Studio for Burn Probability. Note the values or take a screen capture, you need them in the next step.
-
To create the classification including the “Non-burnable” and “Burnable but Not Burned” classes, click Exclusions..., delete the values, and click OK.
-
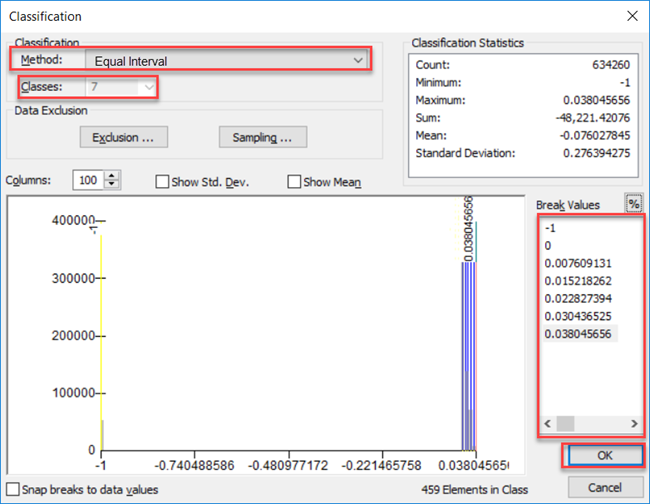
Change the Method to anything other than "Manual", in our example we’ll use “Equal Interval”. Set the Classes to be 7. In the Break Values section, starting at the largest value (bottom of the list) update the last 5 values to match those in step F. Then change the first two to be -1 and 0, respectively. When you are done, click OK.
-
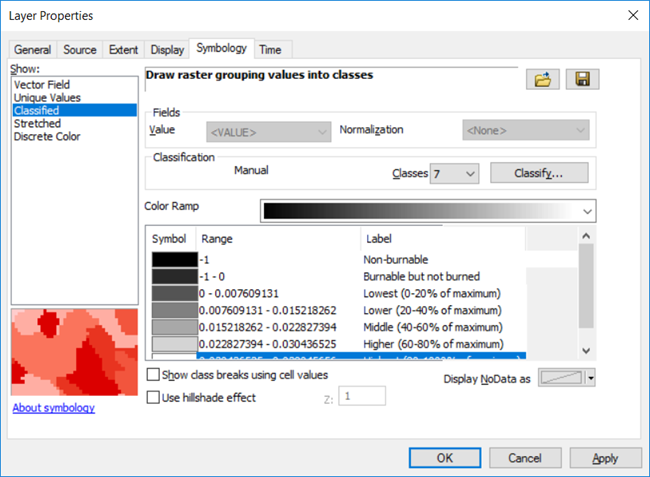
To update the legend in the ArcMap Table of contents, in the Layer Properties window type the correct names under Label. Click OK when you are done.
-
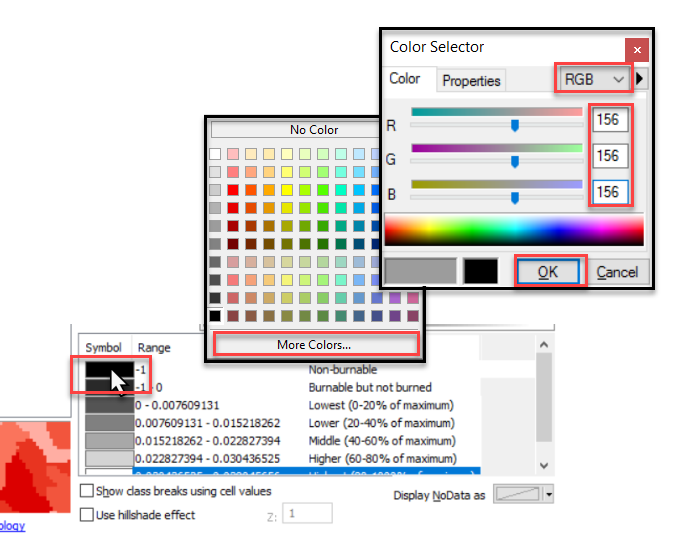
Double-click the symbol next to the "-1" value (-1 represents Non-burnable pixels) . When the Color Selector window opens, click More Colors…, then set the color to “RBG” from the drop-down menu, enter the values R = 156 , G = 156, B = 156, and click OK.
-
Repeat the process for the remaining classes using the table below.
RGB Value for each class. Value R G B -1 (Non burnable) 156 156 156 0 (Burnable but not Burned) 0 0 0 Lowest (0-20% of maximum) 41 219 255 Lower (20-40% of maximum) 135 255 187 Middle (40-60% of maximum) 250 250 100 Higher (60-80% of maximum) 250 138 52 Highest (80-100% of maximum) 232 16 20 - Click OK in the bottom of the Layer Property window to apply the symbology.
-
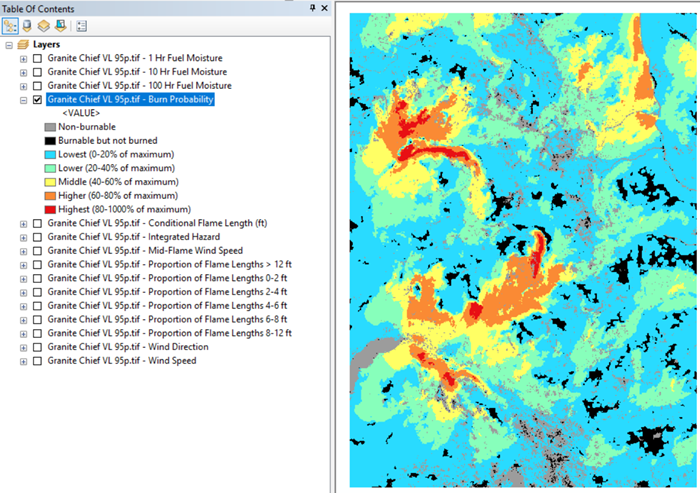
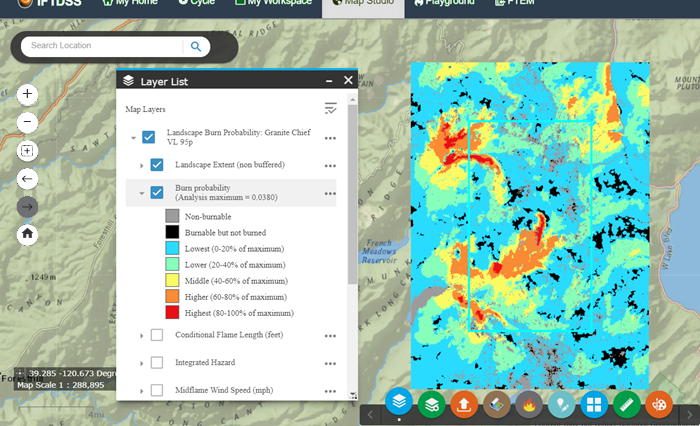
Now you can see the Burn Probability layer in ArcMap (top image) appears the same as it is in Map Studio in IFTDSS (bottom image).