Importing Layer Symbology into ArcMap for Landscapes
IFTDSS uses a specific color scheme for Map Studio and report figures. When you download IFTDSS files for use in Arcmap, you can duplicate this color scheme using our .lyr files contained in the "symbology" folder. The .lyr files contain all the color specifications used by IFTDSS.
Lyr files in the Landscape download includes:
- Aspect
- Canopy Base Height
- Canopy Bulk Density
- Canopy Cover
- Fuel Models
- Slope
- Stand Height
Important! Elevation is dynamic and varies by file, so these two may not apply to your specific download.
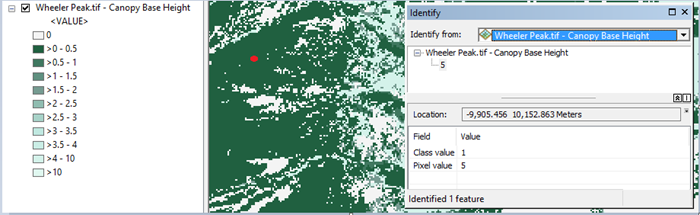
Important! Symbology in IFTDSS downloads does not always match the units in Map Studio. For example, Canopy Base Height displays in Map Studio in meters, but in the downloadable GeoTIFF it displays in meters *10. In the image below, the value for the pixel at the red dot is 5. This is 0.5 m and is in the >0-0.5 class in the legend (darkest green).
See the Landscape (LCP) GeoTIFFs from IFTDSS topic for the units in Map Studio versus the GeoTIFF.
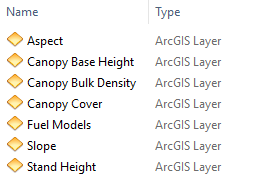
In the Landscape download package available in IFTDSS, we include a folder entitled "symbology." The symbology folder contains ArcGIS Layer (.lyr) files to define the symbology for most of the layers visible in Map Studio for use in ArcMap, as shown in the file list below for a downloaded landscape.
In the GeoTIFF, the Landscape layers are both categorical and continuous data, importing the symbology is slightly different for each type. Below we cover:
- Categorical (Fuel Model)
- Continuous (Slope, Aspect, Canopy Cover, Stand Height, Canopy Base Height, and Canopy Bulk Density)
We have not included a .lyr file for Elevation although Elevation is visible in Map Studio. This is because we do not have set bins to classify/categorize elevation due to the large variation in the range of values across landscapes.
In addition, we have not included ArcGIS Layers files for layers included in the Landscape GeoTIFF not shown in Map Studio. These include: Map Zone, Existing Vegetation Type, Existing Vegetation Height, and Existing Vegetation Cover.
Import Symbology for Fuel Model (categorical data)
The Fuel Model layer in the Landscape GeoTIFF is categorical data. The following steps outline how to import the symbology for categorical data.
- Open an ArcMap session and add the layers you would like to map. Double click the GeoTIFF file to select individual bands. For more information on how to add layers to ArcMap please see the Opening an IFTDSS GeoTIFF file in ArcMap topic.
-
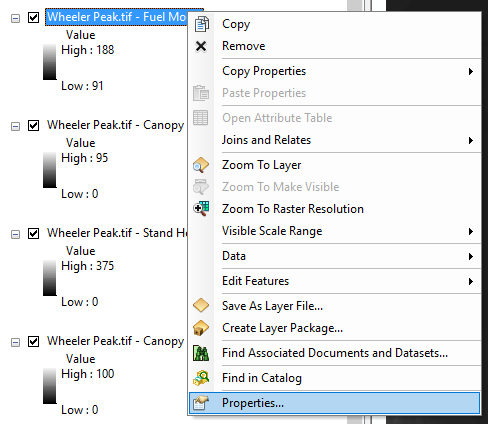
Right-click on the "Fuel Model" layer and click Properties.
-
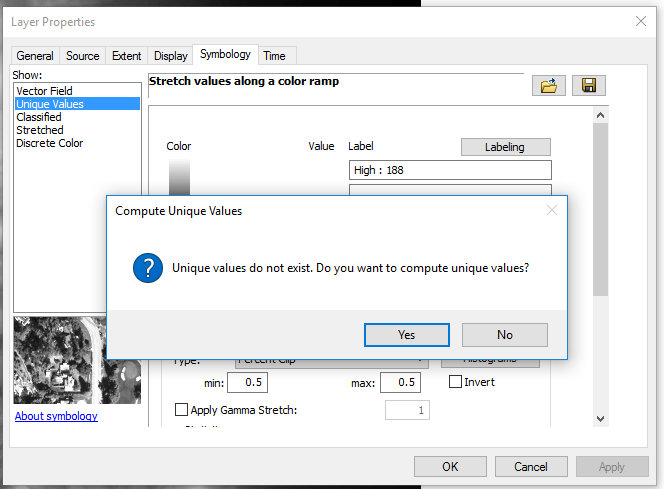
In the Layer Properties window go to the Symbology tab and select "Unique Values." You may get a pop-up window asking if you would like to compute unique values. Click Yes.
-
Click on the Folder icon
 toward the top right of the Layer Properties window. In the Import Symbology window that opens, click on the Folder icon . This opens the Browse window. Select the "FuelModels.lyr" file in the Browse window and click Add.
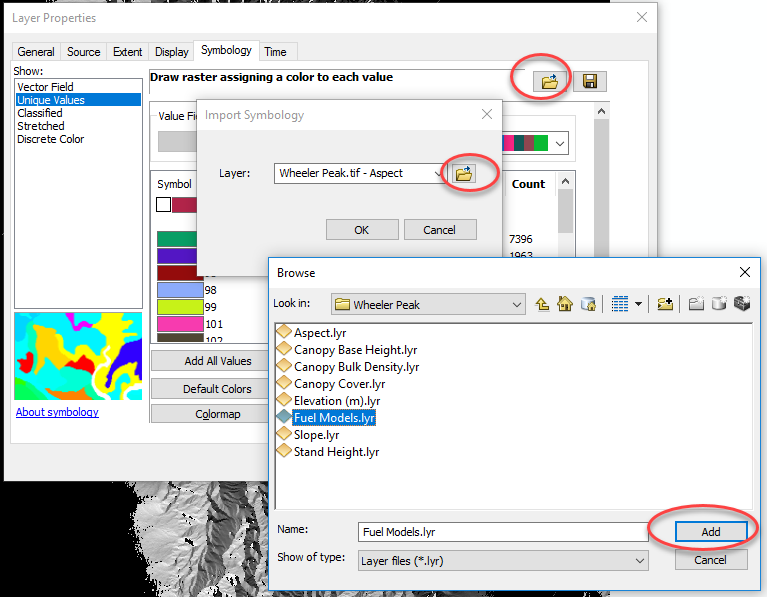
-
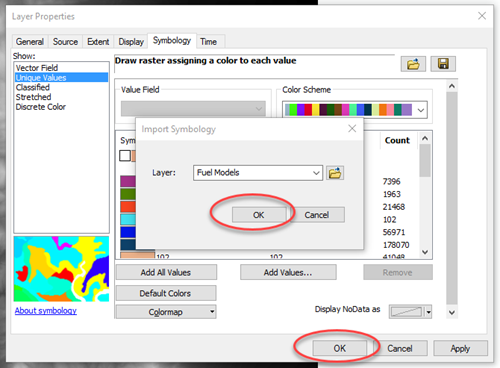
Click OK to close the Import Symbology window, and OK in the bottom of the Layer properties window to apply the symbology.
-
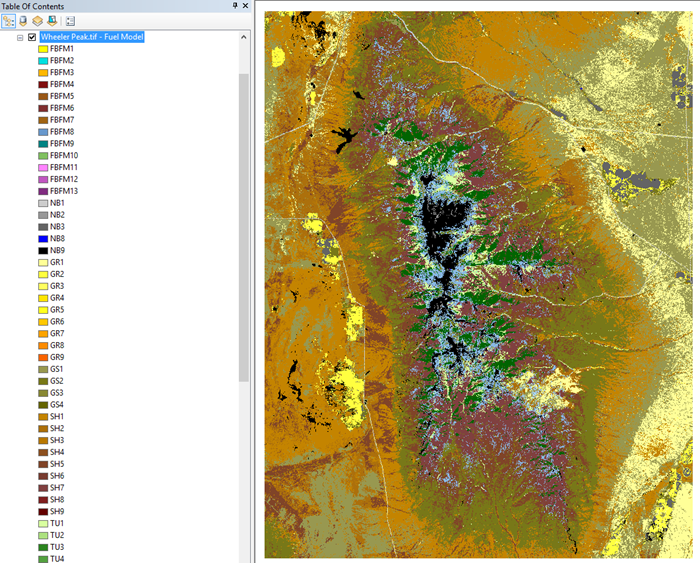
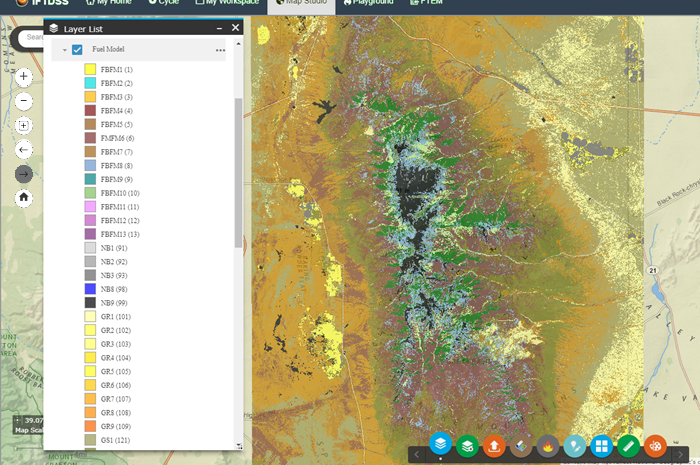
Now you can see Fuel Model in ArcMap is the same as it appears in IFTDSS Map Studio.
Importing Symbology for Slope, Aspect, Canopy Cover, Stand Height, Canopy Base Height, and Canopy Bulk Density (continuous data)
The same steps are completed to import the symbology for Slope, Aspect, Canopy Cover, Stand Height, Canopy Base Height, and Canopy Bulk Density. These data sources are continuous data that are classified into distinct bins. The following steps outline how to import the symbology for continuous data. The example below will use Canopy Base Height; however, the same steps are applied to the remaining layers.
-
Open an ArcMap session and add the layers you would like to map. For more information on how do add layers to ArcMap please see the Opening an IFTDSS Geo Tiff file in ArcMap topic.
-
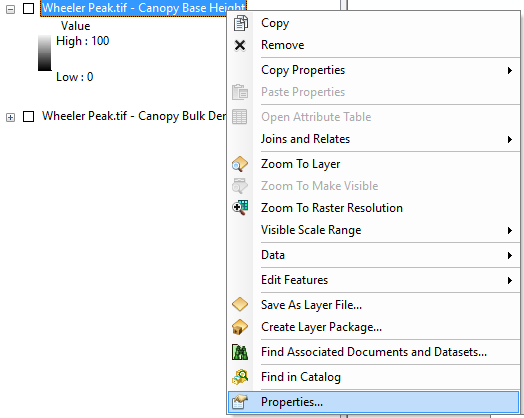
Right-click on the "Canopy Base Height" layer and click Properties.
-
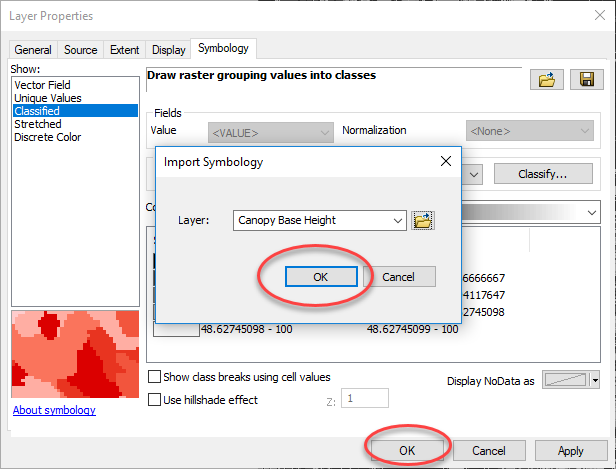
In the Layer Properties window go to the Symbology tab and select "Classified."

-
Click on the Folder icon
toward the top right of the Layer Properties window. In the Import Symbology window that opens, click on the folder icon. This opens the Browse window. Select the "Canopy Base Height.lyr" file in the Browse window and click Add.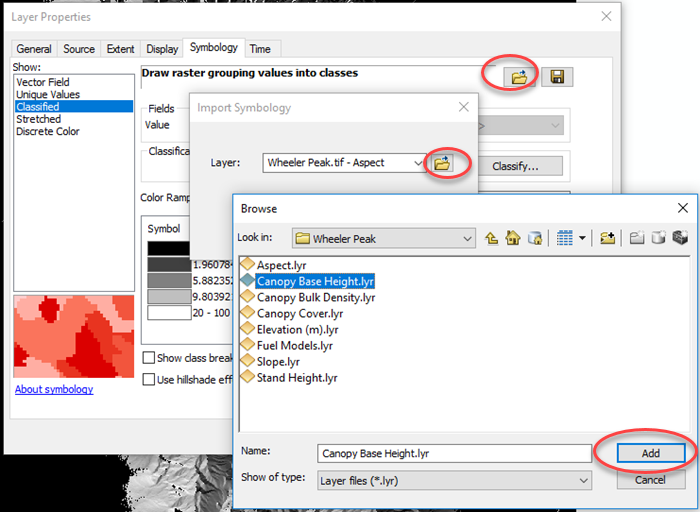
-
Click OK to close the Import Symbology window, and OK in the bottom of the Layer properties window to apply the symbology.
-
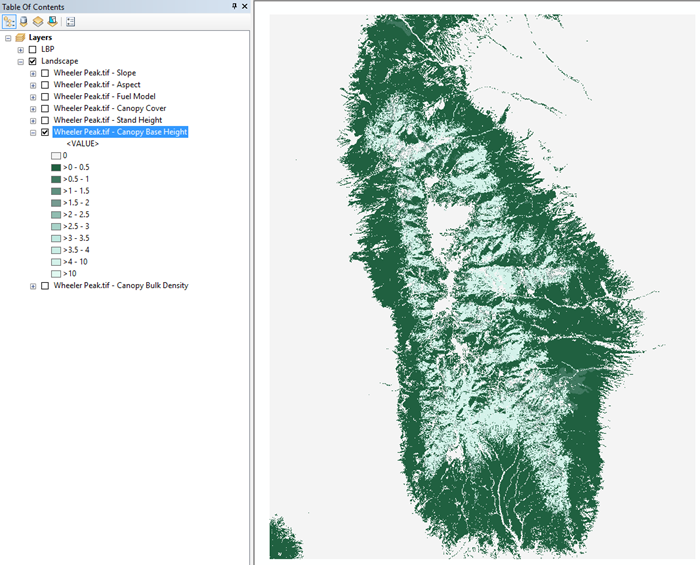
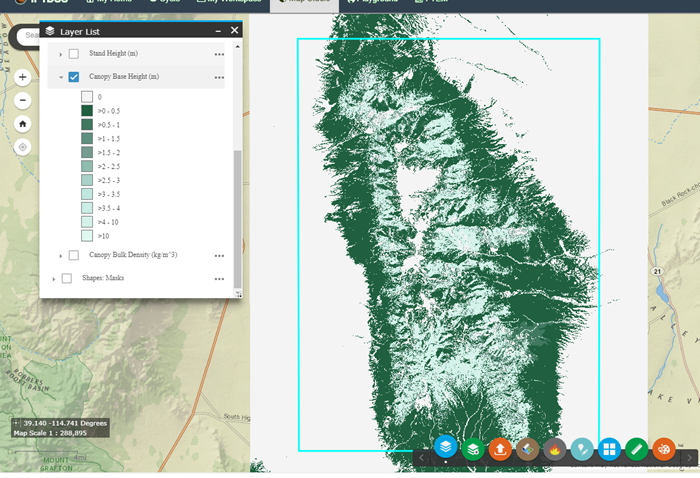
Now you can see Canopy Base Height in ArcMap (top image) the same as it is in Map Studio in IFTDSS (bottom image).