Importing Layer Symbology into ArcMap for Minimum Travel Time Fire Spread (MTT) Outputs
IFTDSS uses a specific color scheme for Map Studio and report figures. When you download IFTDSS files for use in Arcmap, you can duplicate this color scheme using our .lyr files contained in the "symbology" folder. The .lyr file contains all the color specifications used by IFTDSS.
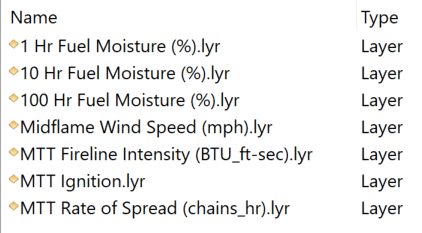
Lyr files in the Minimum Travel Time Fire Spread (MTT) download include:
- MTT Ignition
- MTT Rate of Spread
- MTT Fireline Intensity
- Midflame Wind Speed
- 1-hr Fuel Moisture
- 10-hr Fuel Moisture
- 100-hr Fuel Moisture
Important! MTT Arrival Time is dynamic and varies by run, thus it does not have an lyr symbology file. See the MTT Arrival Time steps below for details and setting symbology for it.
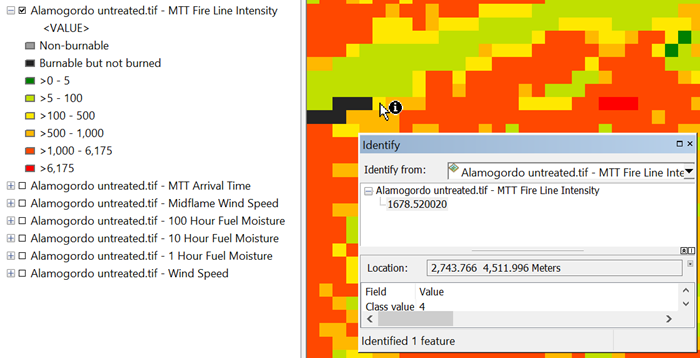
Important! The symbology was designed to match the units in Map Studio; however, the units in GeoTIFF are not always the same. For example, MTT Fireline Intensity is kW/m in the GeoTIFF, and BTU/ft-sec in the legend. In the image below, the value for the pixel under the mouse cursor is 1678.5 kW/m. This is 485 BTU/ft-sec and is in the >100 - 500 class in the legend (yellow).
See the Landscape (LCP) GeoTIFFs from IFTDSS topic for the units in Map Studio versus the GeoTIFF.
In the MTT download package available in IFTDSS, we include a folder entitled "symbology." The symbology folder contains ArcGIS Layer (.lyr) files to define the symbology for most of the layers visible in Map Studio for use in ArcMap. In the GeoTIFF, the MTT layers are both categorical and continuous data, therefore importing the symbology is slightly different for the two types.
We have not included layer files for layers included in MTT GeoTIFF not shown in Map Studio. These include Wind Direction and Wind Speed.
Importing symbology for MTT Ignition
The MTT Ignition layer in the MTT GeoTIFF is categorical data. The following steps outline how to import the symbology for categorical data. If you used barriers in the run, those will be contained in this layer as well. This example includes both ignition patterns (represented with a raster of 1) and barriers (represented with a 0). To set symbology for MTT Ignition:
- Open ArcMap session and add the layers you would like to map. For more information on how to add layers to ArcMap please see the Opening an IFTDSS GeoTIFF file in ArcMap topic.
-
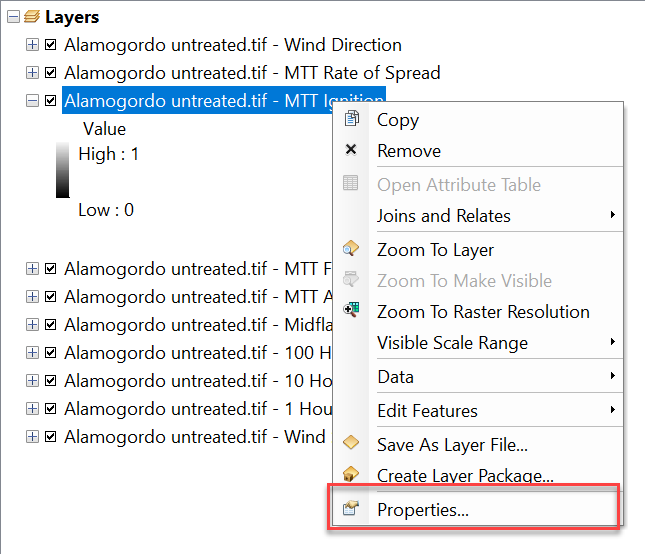
Right-click on the "MTT Ignition" layer and click Properties.
-
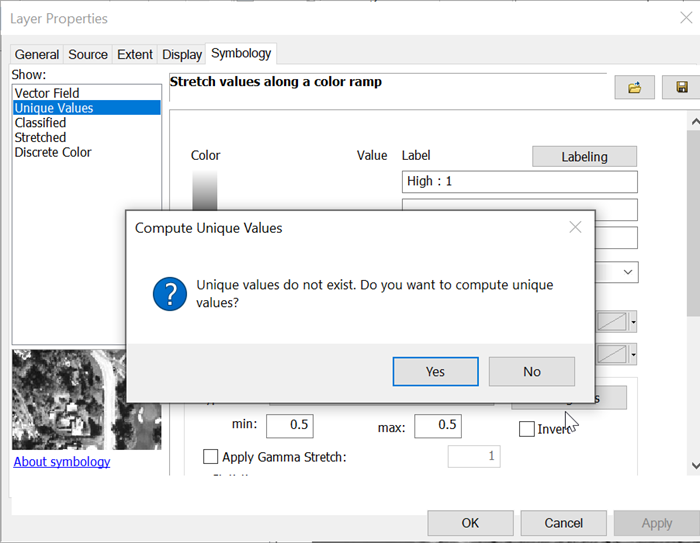
In the Layer Properties window go to the Symbology tab and select Unique Values. You may get a pop-up window asking if you would like to compute unique values. Click Yes.
-
Click on the Folder icon
 toward the top right of the Layer Properties window. In the Import Symbology window that opens, click on the Folder icon . This opens the Browse window. Select the MTT Ignition.lyr" file in the Browse window and click Add.
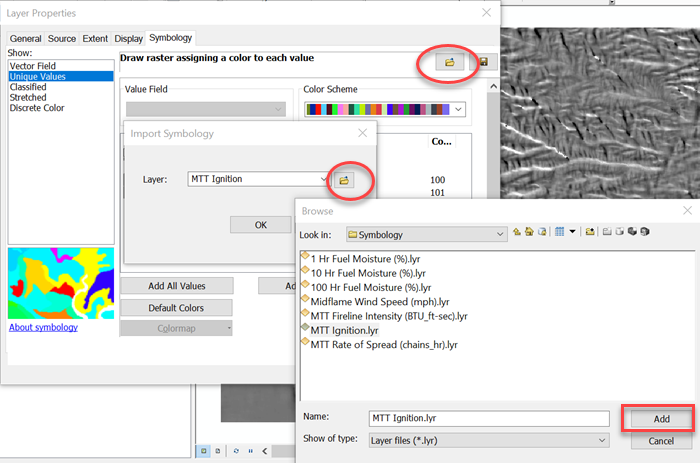
-
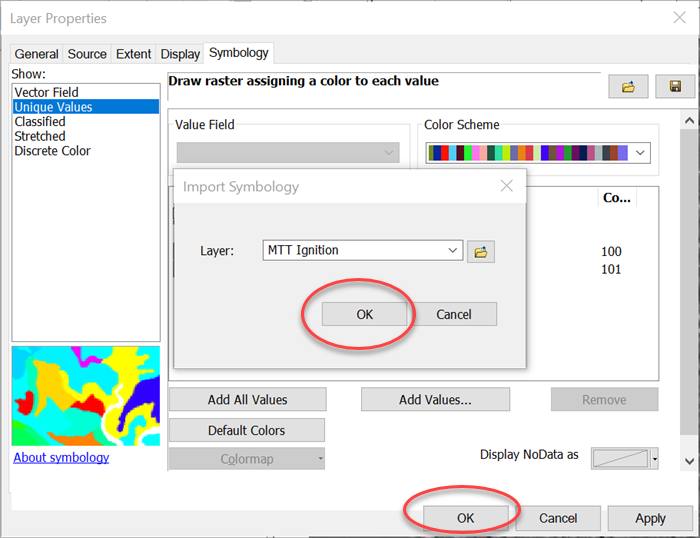
Click OK to close the Import Symbology window, and OK in the bottom of the Layer properties window to apply the symbology.
-
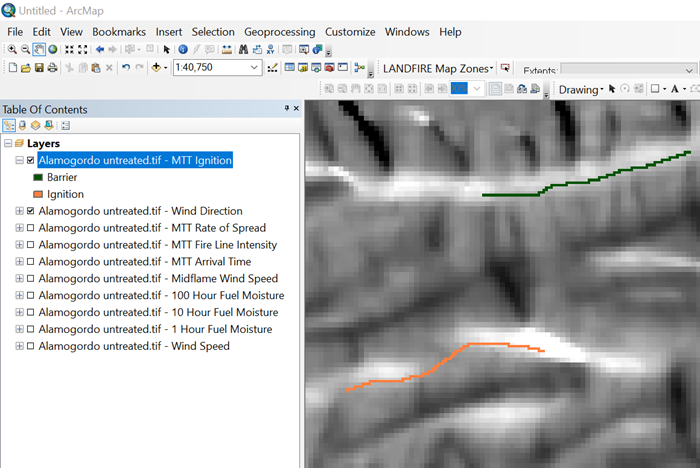
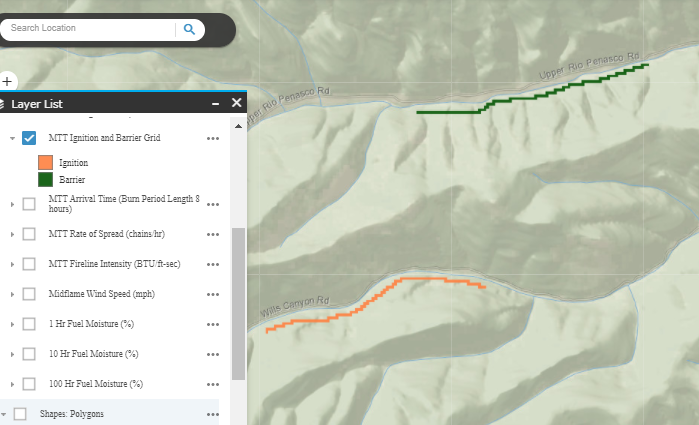
Now you can see the Ignition (orange) and Barrier (green) displayed in ArcMap (top image) the same as it is in Map Studio in IFTDSS (bottom image).
Importing symbology for MTT Rate of Spread, MTT Fireline Intensity, Midflame Wind Speed, and 1, 10, and 100 Hour Fuel Moistures
The same steps are completed to import the symbology for MTT Rate of Spread, MTT Fireline Intensity, Midflame Wind Speed, and 1, 10, and 100 Hour Fuel Moistures. These data sources are continuous data that are classified into distinct bins. The following steps outline how to import the symbology for continuous data. The example below will use MTT Fire Line Intensity; however, the same steps are applied to the remaining layers.
- Open ArcMap session and add the layers you would like to map. For more information on how to add layers to ArcMap please see the Opening an IFTDSS GeoTIFF file in ArcMap topic.
-
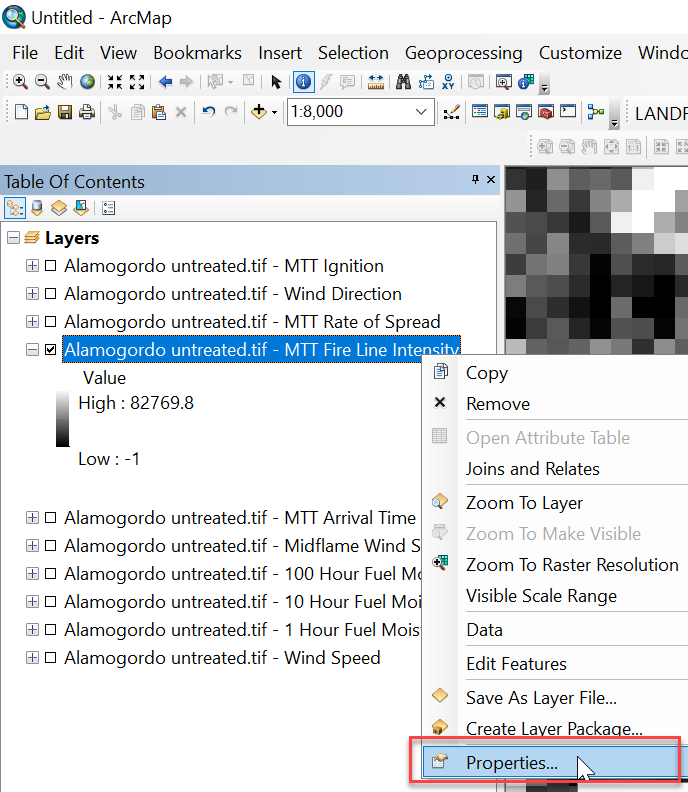
Right-click on the "MTT Fire Line Intensity" and click Properties.
-
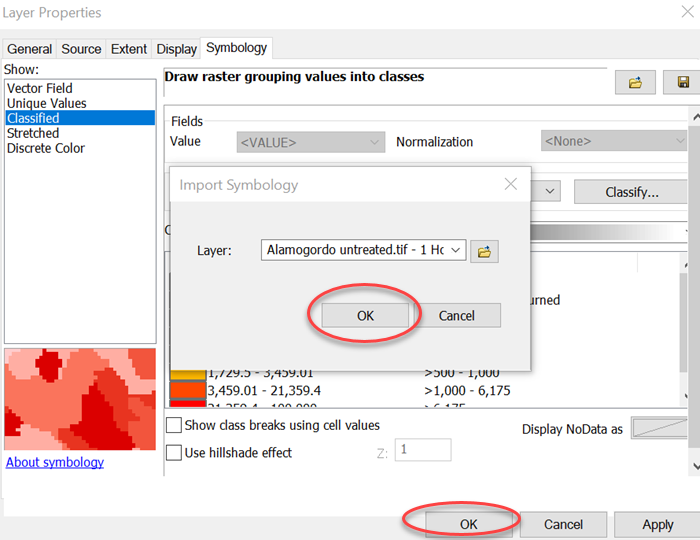
In the Layer Properties window go to the Symbology tab and select "Classified."

-
Click on the Folder icon
toward the top right of the Layer Properties window. In the Import Symbology window that opens, click on the folder icon. This opens the Browse window. Select the "MTT Fire Line Intensity.lyr" file in the Browse window and click Add.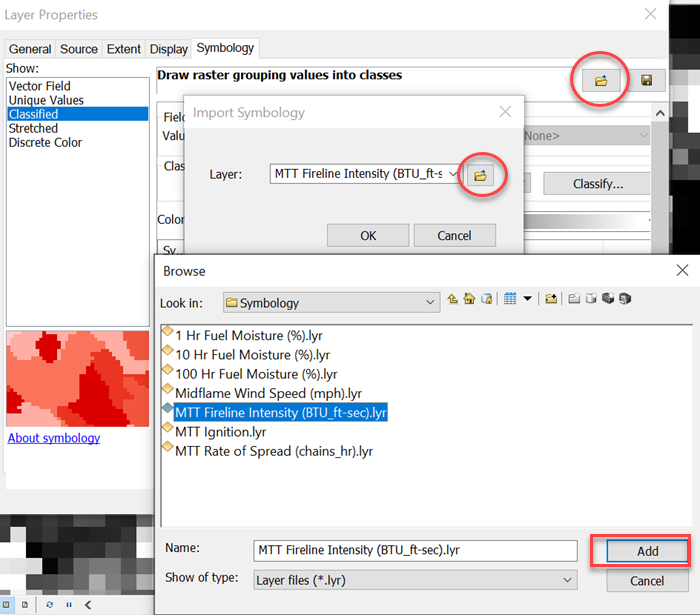
-
Click OK to close the Import Symbology window, and OK in the bottom of the Layer properties window to apply the symbology.
-
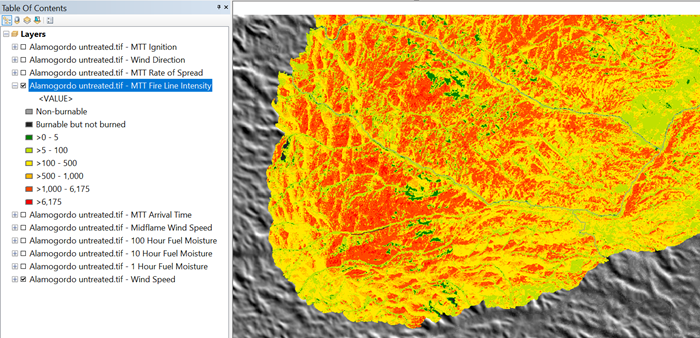
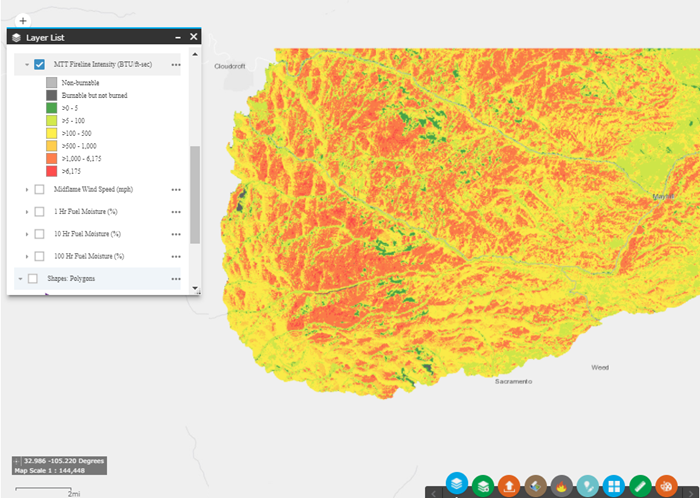
Now you can see MTT Fire Line Intensity in ArcMap (top image) the same as it is in Map Studio in IFTDSS (bottom image).
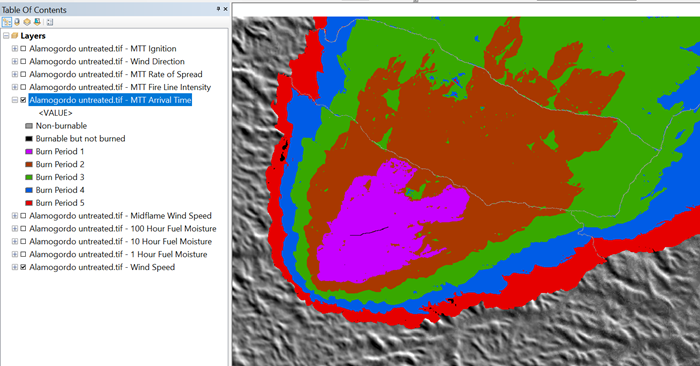
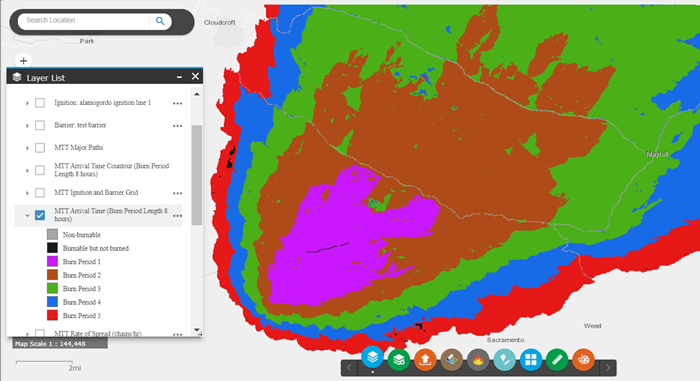
Applying Symbology for MTT Arrival Time
For MTT Arrival Time, the legend is dynamically applied depending upon how many burn periods you specified when running the model, so there is not ArcGIS Layer file included in the download package. The steps below walk-through the process of classifying your MTT Arrival Time in Arcmap using the same break values used in IFTDSS, and setting the color ramp to the same values for those periods.
- Open ArcMap session and add the layers you would like to map. For more information on how do add layers to ArcMap please see the Opening an IFTDSS Geo Tiff file in ArcMap topic.
-
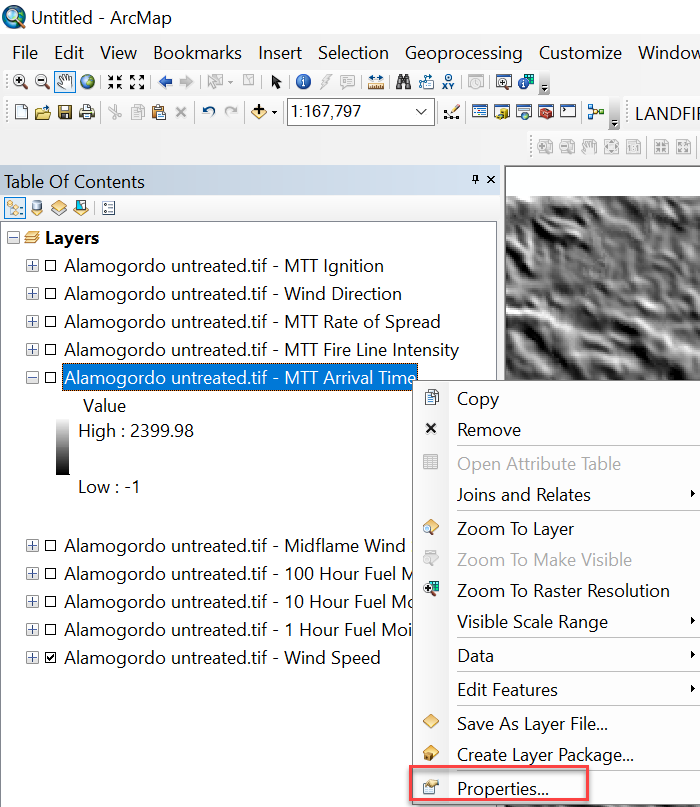
Right-click on the "MTT Arrival Time" layer and click Properties.
-
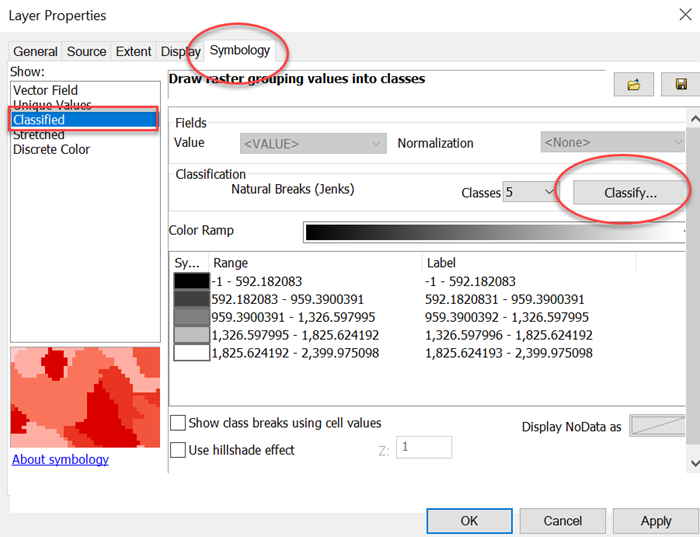
To determine the break values for the classification, in the Layer Property window, go to the Symbology tab, select "Classified", then click the Classify button.
-
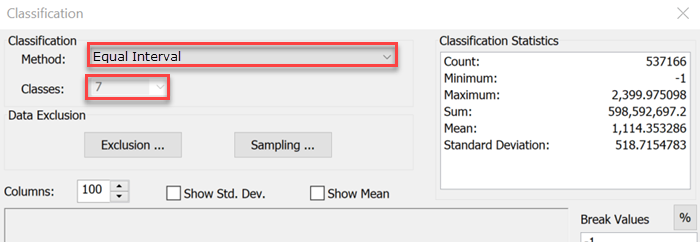
In the Classification window, change the Method to anything other than "Manual", in our example we’ll use “Equal Interval”. For Classes, set the number to be two higher than your number of burn periods so that you can accommodate "non-burnable" and "burnable but not burned" categories. In this example we've used five burn periods so we'll set this value to 7.
-
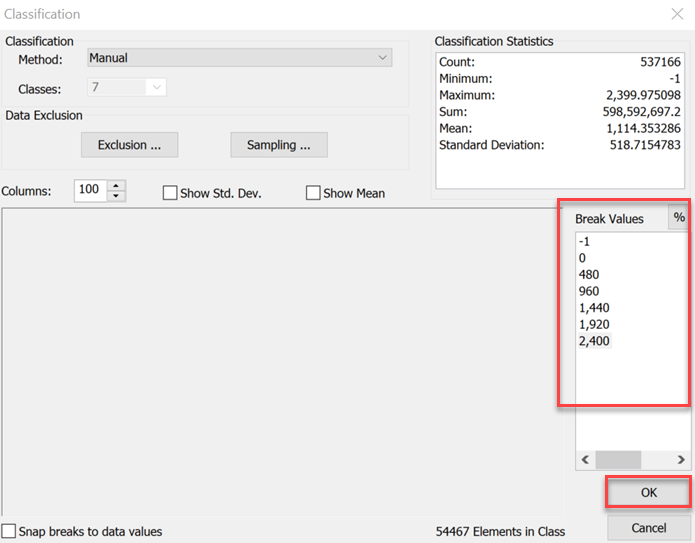
Next, go to the Break Values box in the bottom right. Populate this with "-1", followed by "0" to classify the non-burnable and burnable but not burned pixels. For the rest of the break values, insert the time elapsed, in minutes, for each burn period. For this example we used 8 hours per burn period, and five burn periods. So our values are set to 480, 960,1440, 1920, and 2400. When you are done, click OK.
-
With the Symbology tab of the Layer Properties window still open, double click each label and type the correct names under Label. This will update the legend in the ArcMap table of contents. Click OK when you are done.

-
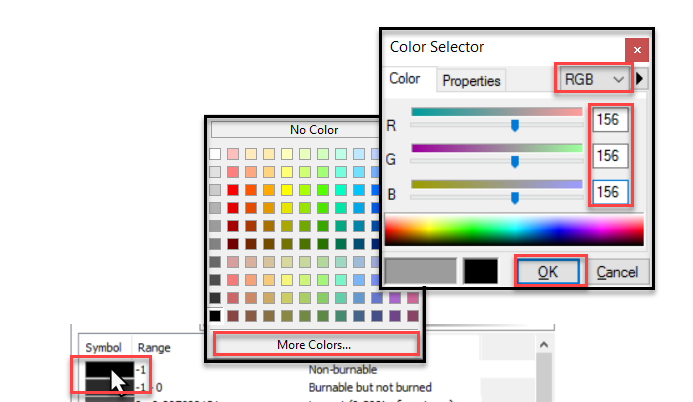
Set the color for the labels by double-clicking the symbol next to the "-1" value (-1 represents Non-burnable pixels) . When the Color Selector window opens, click More Colors…, then set the color to “RBG” from the drop-down menu, enter the values R = 156 , G = 156, B = 156, and click OK.
-
Repeat the process in step G for the remaining classes using the values in the table below.
RGB Value for each class. Value R G B -1 (Non burnable) 156 156 156 0 (Burnable but not Burned) 0 0 0 Burn Period 1 197 0 255 Burn Period 2 168 56 0 Burn Period 3 56 168 0 Burn Period 4 0 92 230 Burn Period 5 230 0 0 - Click OK in the bottom of the Layer Property window to apply the symbology.
-
Now you can see the MTT Arrival Time layer in ArcMap (top image) appears the same as it is in Map Studio in IFTDSS (bottom image).