In My Workspace, you may generate a summary report to assess landscape features and model outputs. Reports contain a variety of graphs and tables that can each be downloaded individually to use in your own documents. You may also choose to download the entire report as a PDF.
Generate a Report
-
From My Workspace, locate and right click on the landscape or model output file then select Request Report from the dropdown menu. A report dialogue box will open.
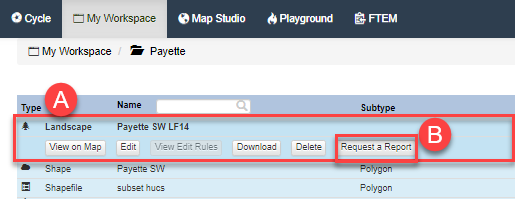
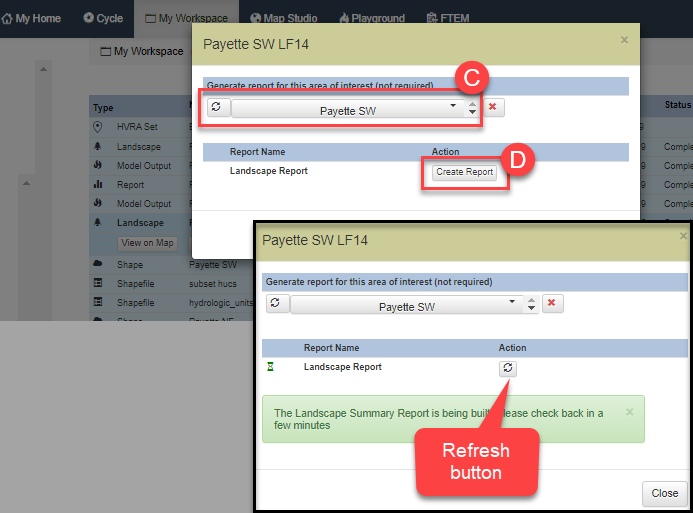
- (Optional) Specify an area of interest to constrain the report. If you leave this blank, the report summarizes the extent of the entire landscape or output.
-
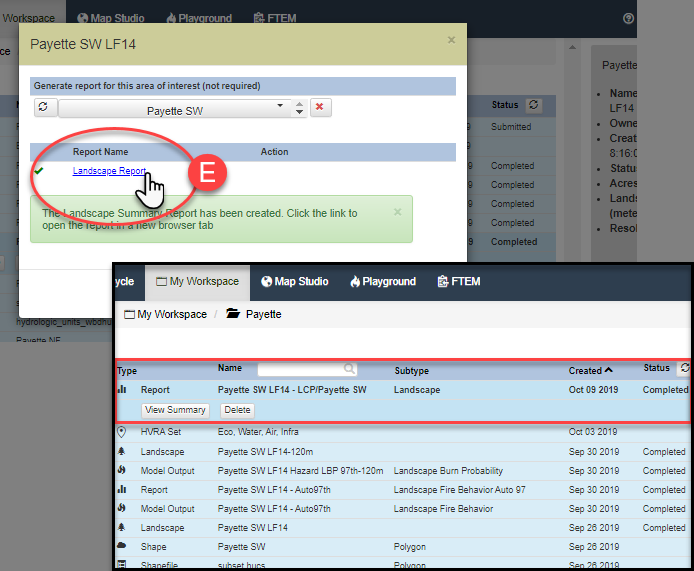
Click Create Report. You may use the refresh button to check whether your report is ready. Reports may take several minutes to generate depending on file size.
-
When ready, the Refresh button will turn into a View Report button. The report will also be visible in My Workspace, stored in the same folder as the file it summarizes. Clicking the View Report button, or View Summary button in My Workspace will open the report in a new tab.
Important! A maximum of 12 summary report requests may be submitted at any given time. If you see a pop-up notifying you that this number has been exceeded, complete your task when one of the other requests has completed.
View and Save Reports
- Reports can be viewed anytime from My Workspace by selecting the report and clicking the View Summary button in the list of file options that appears when you click the report file.
-
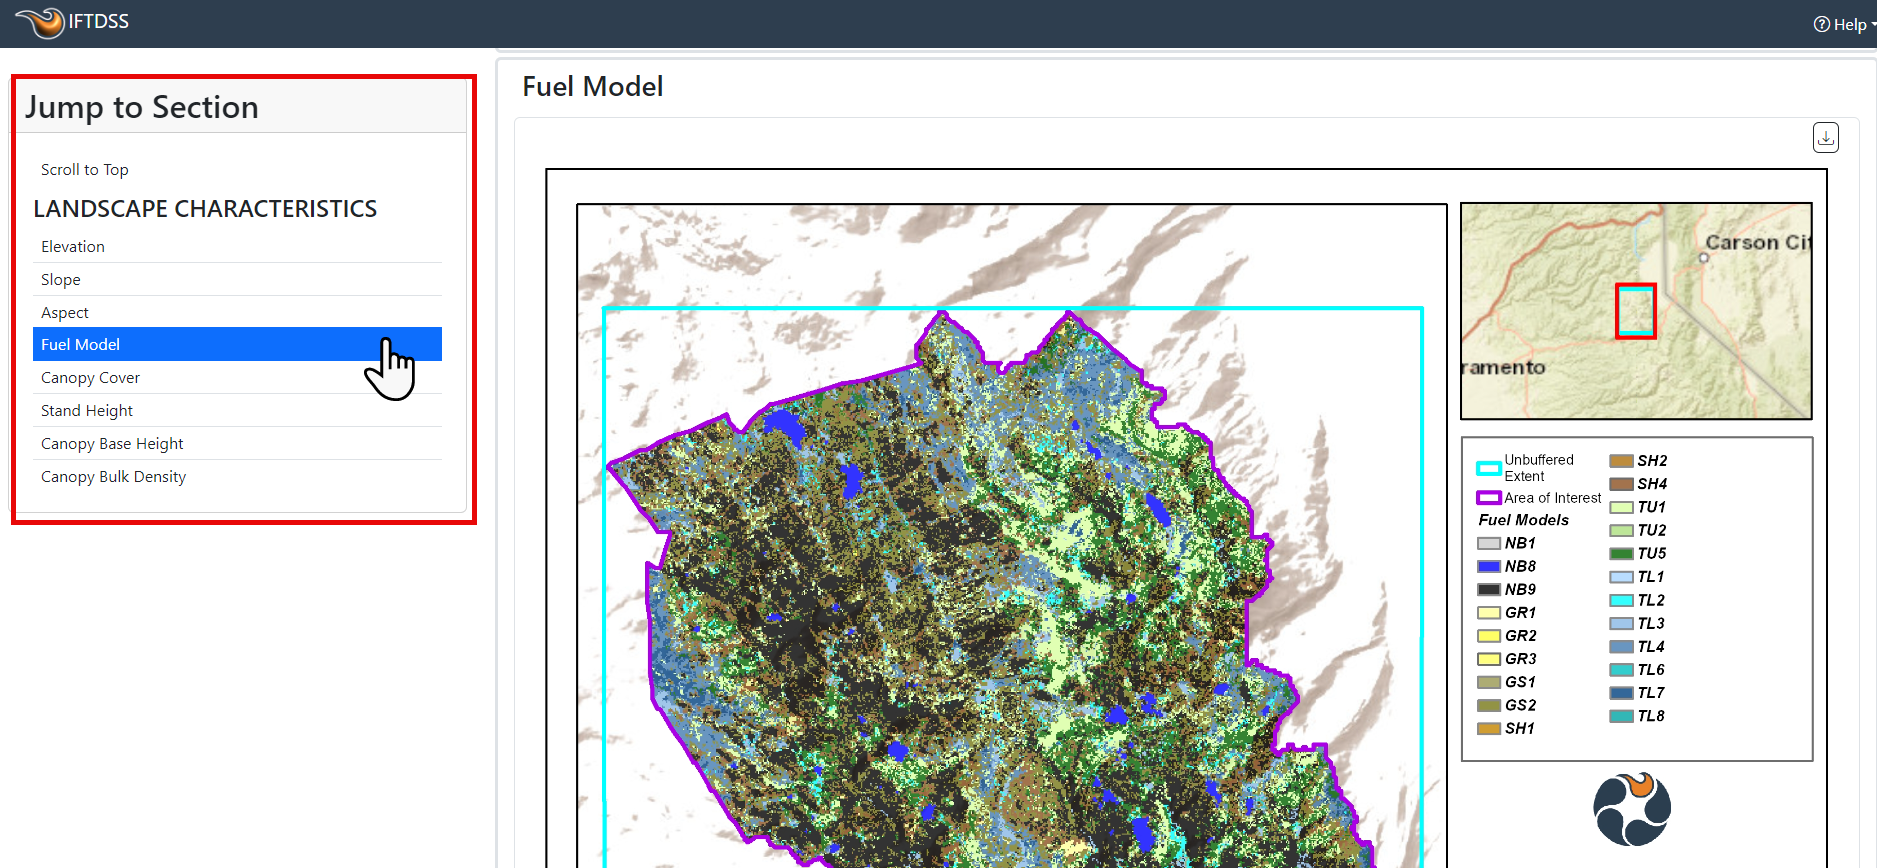
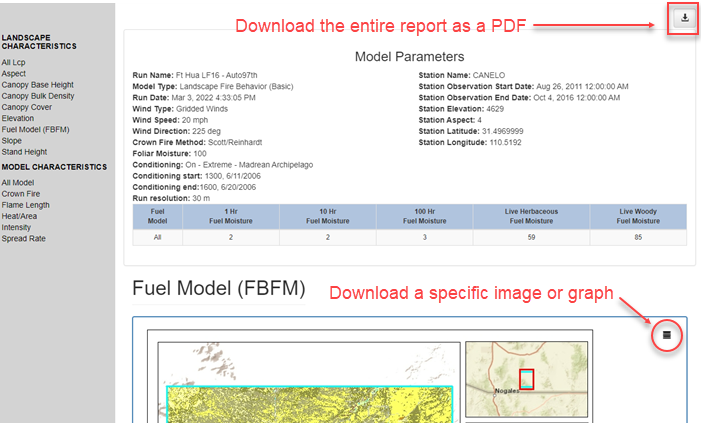
Reports open in a new browser tab. You may choose to scroll through the report, or use the linked table of contents on the left side of the report to skip to a specific section.
-
In addition to being saved in My Workspace, you may also save summary reports to your local computer. This includes:
-
The full report saved as a PDF.
-
A section of a report saved as a PDF.
-
An individual table saved in CSV, PDF, or Excel format.
-
An individual graph saved in JPG, PNG, or PDF format.
-