Quantitative Wildfire Risk Assessment (QWRA) Technical Documentation
Calculating Relative Importance Per Pixel (RIPP)
In order to calculate Conditional Weighted NVC, first the Relative Importance Per Pixel (RIPP) needs to be calculated. RIPP takes into account the Relative Importance (RI) values for both Primary HVRA Categories and the Sub-HVRAs entered in the application, as well as the Relative Extent (RE) which is the number of burnable pixels in each Sub-HVRA footprint. We include the calculated RIPP values within the download package.
There are a three steps involved in calculating RIPP:
RIPP Calculation Step 1
The first relies on the Primary HVRA Category RI values to calculate ‘Of1M.’ In the example spreadsheet, the ‘Primary HVRA RI’ is what was entered into the IFTDSS interface. The ‘Percent of total Primary RI’ is the percentage of the given Primary HVRA RI relative to the sum of all the Primary HVRA RI values. And ‘Of1M’ is the ‘Percent of total Primary RI’ multiplied by 1,000,000.
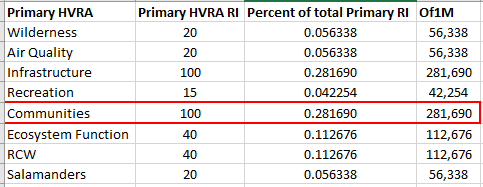
For example, we will illustrate the calculations for Communities:
‘Of1MCommunities’ = (Primary HVRA RICommunities / (Primary HVRA RIWilderness + Primary HVRA RIAir Quality + Primary HVRA RI Infrastructure + Primary HVRA RI Recreation + Primary HVRA RI Communities + Primary HVRA RI Ecosystem Function + Primary HVRA RI RCW + Primary HVRA RI Salamanders)) * 1,000,000
= (100 / (20 + 20 + 100 +15 + 100 + 40 +40 + 20)) * 1,000,000
= 0.281690 * 1,000,000
= 281,690
RIPP Calculation Step 2
Second, the sum product of the Sub-HVRA RE and RI are calculated for each Primary HVRA Category independently. For this calculation, the ‘Sub-HVRA RI’ is what was entered into the IFTDSS interface. This value is divided by 100, ‘Sub-HVRA RI / 100’. Then that is multiplied by the ‘Relative Extent (pixels)’ to get the ‘Sum’. Finally the ‘Sum Product” is calculated, which is the product of the summed values within a given Primary HVRA Category.
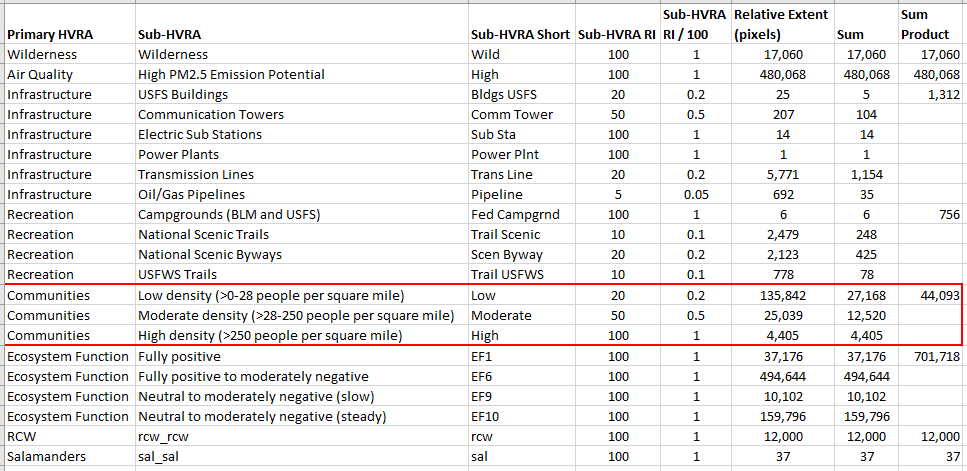
We will continue with the Communities example:
‘Sum Product Communities’ = ((Sub HVRA RI Low /100) * RE Low) + (Sub HVRA RI Moderate /100) * RE Moderate) + (Sub HVRA RI High /100) * RE High)
= ((0.2 * 135,842) + (0.5 * 25,039) + (1 * 4,405))
= 27,168 + 12,520 + 4,405
= 44,093
RIPP Calculation Step 3
Third, to calculate the RIPP for a given Sub-HVRA, the ‘Of1M’, ‘Sum Product’ and ‘Sub-HVRA RI / 100’ are used.
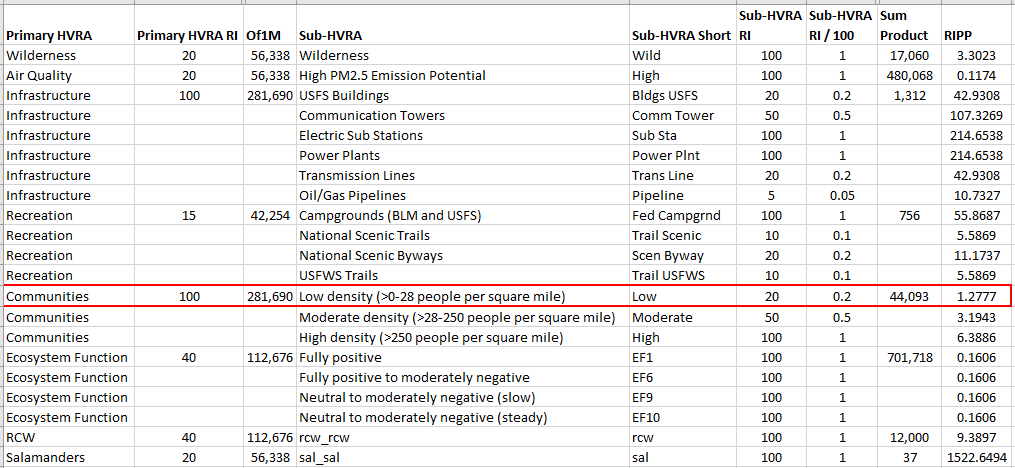
We will continue with the Communities example calculating RIPP for the Low Sub-HVRA.
RIPP Low = (‘Of1M Communities’ / ‘Sum Product Communities’) * (Sub HVRA RI Low /100))
= (281,690 / 44,093) * 0.2
=1.2777
Calculating Conditional Weighted NVC
Conditional Weighted NVC (C(wNVC)) is conditional on a fire occurring, therefore it does not include Burn Probability in the calculation. C(wNVC) is calculated for each pixel using the Proportion of Flame Length outputs from Landscape Burn Probability model outputs, Response Functions (RF) and Relative Importance Per Pixel (RIPP) for all Sub-HVRAs present.
Conditional Weighted NVC = ΣΣ RIPP * (RF * Proportion of Flame Length)
Conditional Weighted NVC is the sum of the product of RIPP, Response Functions and Proportion of Flame Lengths (by class) for all Sub-HVRAs present.
We will use the values in the from ![]() Identify in addition to the *.csv file that is included in the Risk Assessment download which includes the RF and RIPP to illustrate how C(wNVC) is calculated for a single pixel. In the example, the pixel overlaps three Sub-HVRAS: Threatened Vertebrates (Threat Vert P, black), Endangered Vertebrates (Endg Vert P, purple), and All Positive, decreasing slightly (EF2, orange).
Identify in addition to the *.csv file that is included in the Risk Assessment download which includes the RF and RIPP to illustrate how C(wNVC) is calculated for a single pixel. In the example, the pixel overlaps three Sub-HVRAS: Threatened Vertebrates (Threat Vert P, black), Endangered Vertebrates (Endg Vert P, purple), and All Positive, decreasing slightly (EF2, orange).
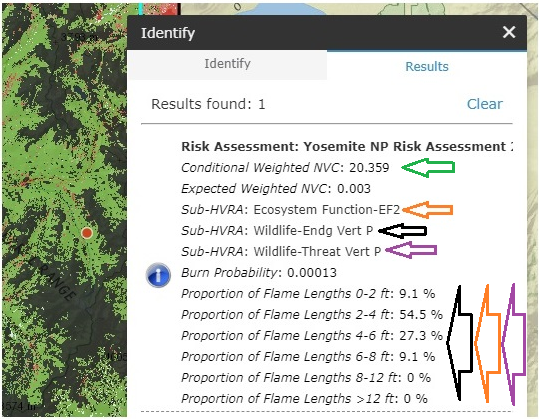
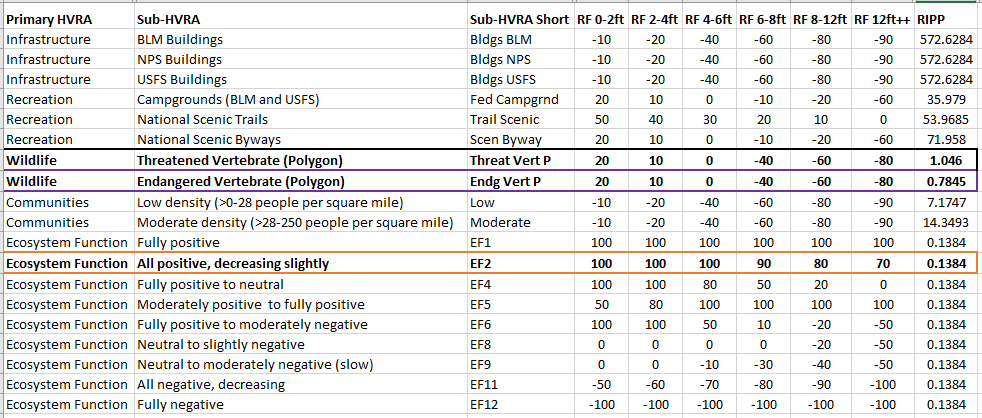
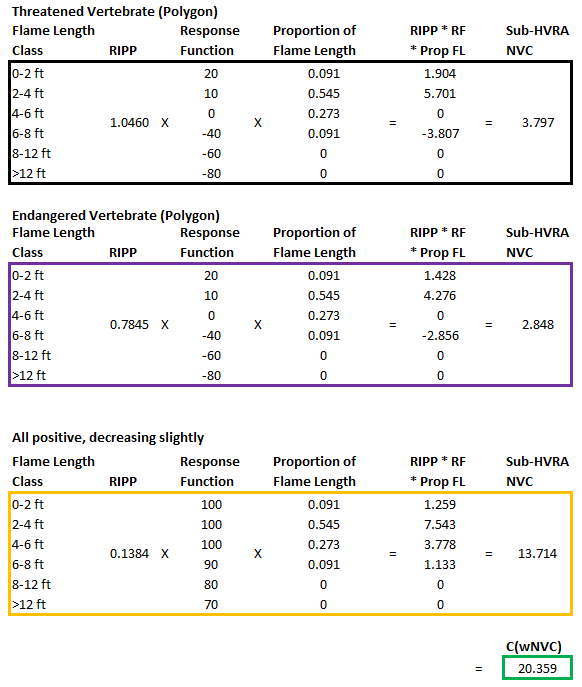
Conditional Weighted NVC = ((1.046 * ((20 * 0.091) + (10 * 0.545) + (0 * 0.273) + (-40 * 0.091) + (-60 * 0) + (-80 * 0.0))) + ((0.7845 * ((20 * 0.091) + (10 * 0.545) + (0 * 0.273) + (-40 * 0.091) + (-60 * 0) + (-80 * 0.0))) + ((0.1384 * ((100 * 0.091) + (100 * 0.545) + (100 * 0.273) + (90 * 0.091) + (80 * 0) + (70 * 0.0)))
= (1.046 * (1.82 + 5.45 + 0 + -3.64 + 0 + 0)) + (0.7845 * (1.82 + 5.45 + 0 + -3.64 + 0 + 0))) + (0.1384 * (9.1 + 54.5 + 27.3 + 8.19 + 0 + 0))
= 3.797 + 2.848 + 13.714
= 20.359
The graphic below demonstrates the same calculation process in a visual format that might be easier for some to follow.
Calculating Expected Weighted NVC
Expected Weighted NVC is where the likelihood leg of the Risk Assessment triangle comes in. Quite simply, it is the product of Burn Probability and Conditional Weighted NVC. The value is calculated for each pixel in the analysis area.
Expected Weighted NVC = Burn Probability × Conditional Expected NVC
We will use the values from ![]() Identify, shown below, to illustrate how E(wNVC) is calculated for a single pixel.
Identify, shown below, to illustrate how E(wNVC) is calculated for a single pixel.
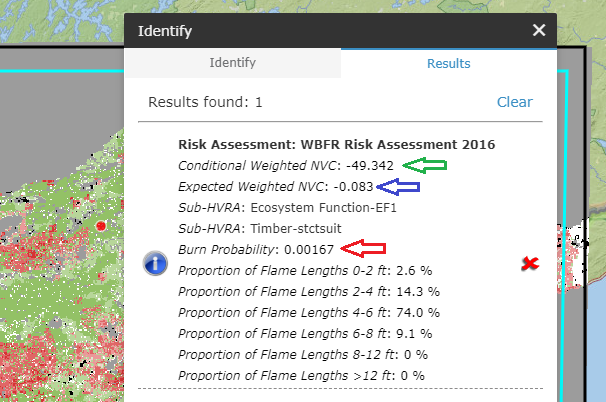
Expected Weighted NVC = 0.00167 x –49.342
= -0.083