The following page covers:
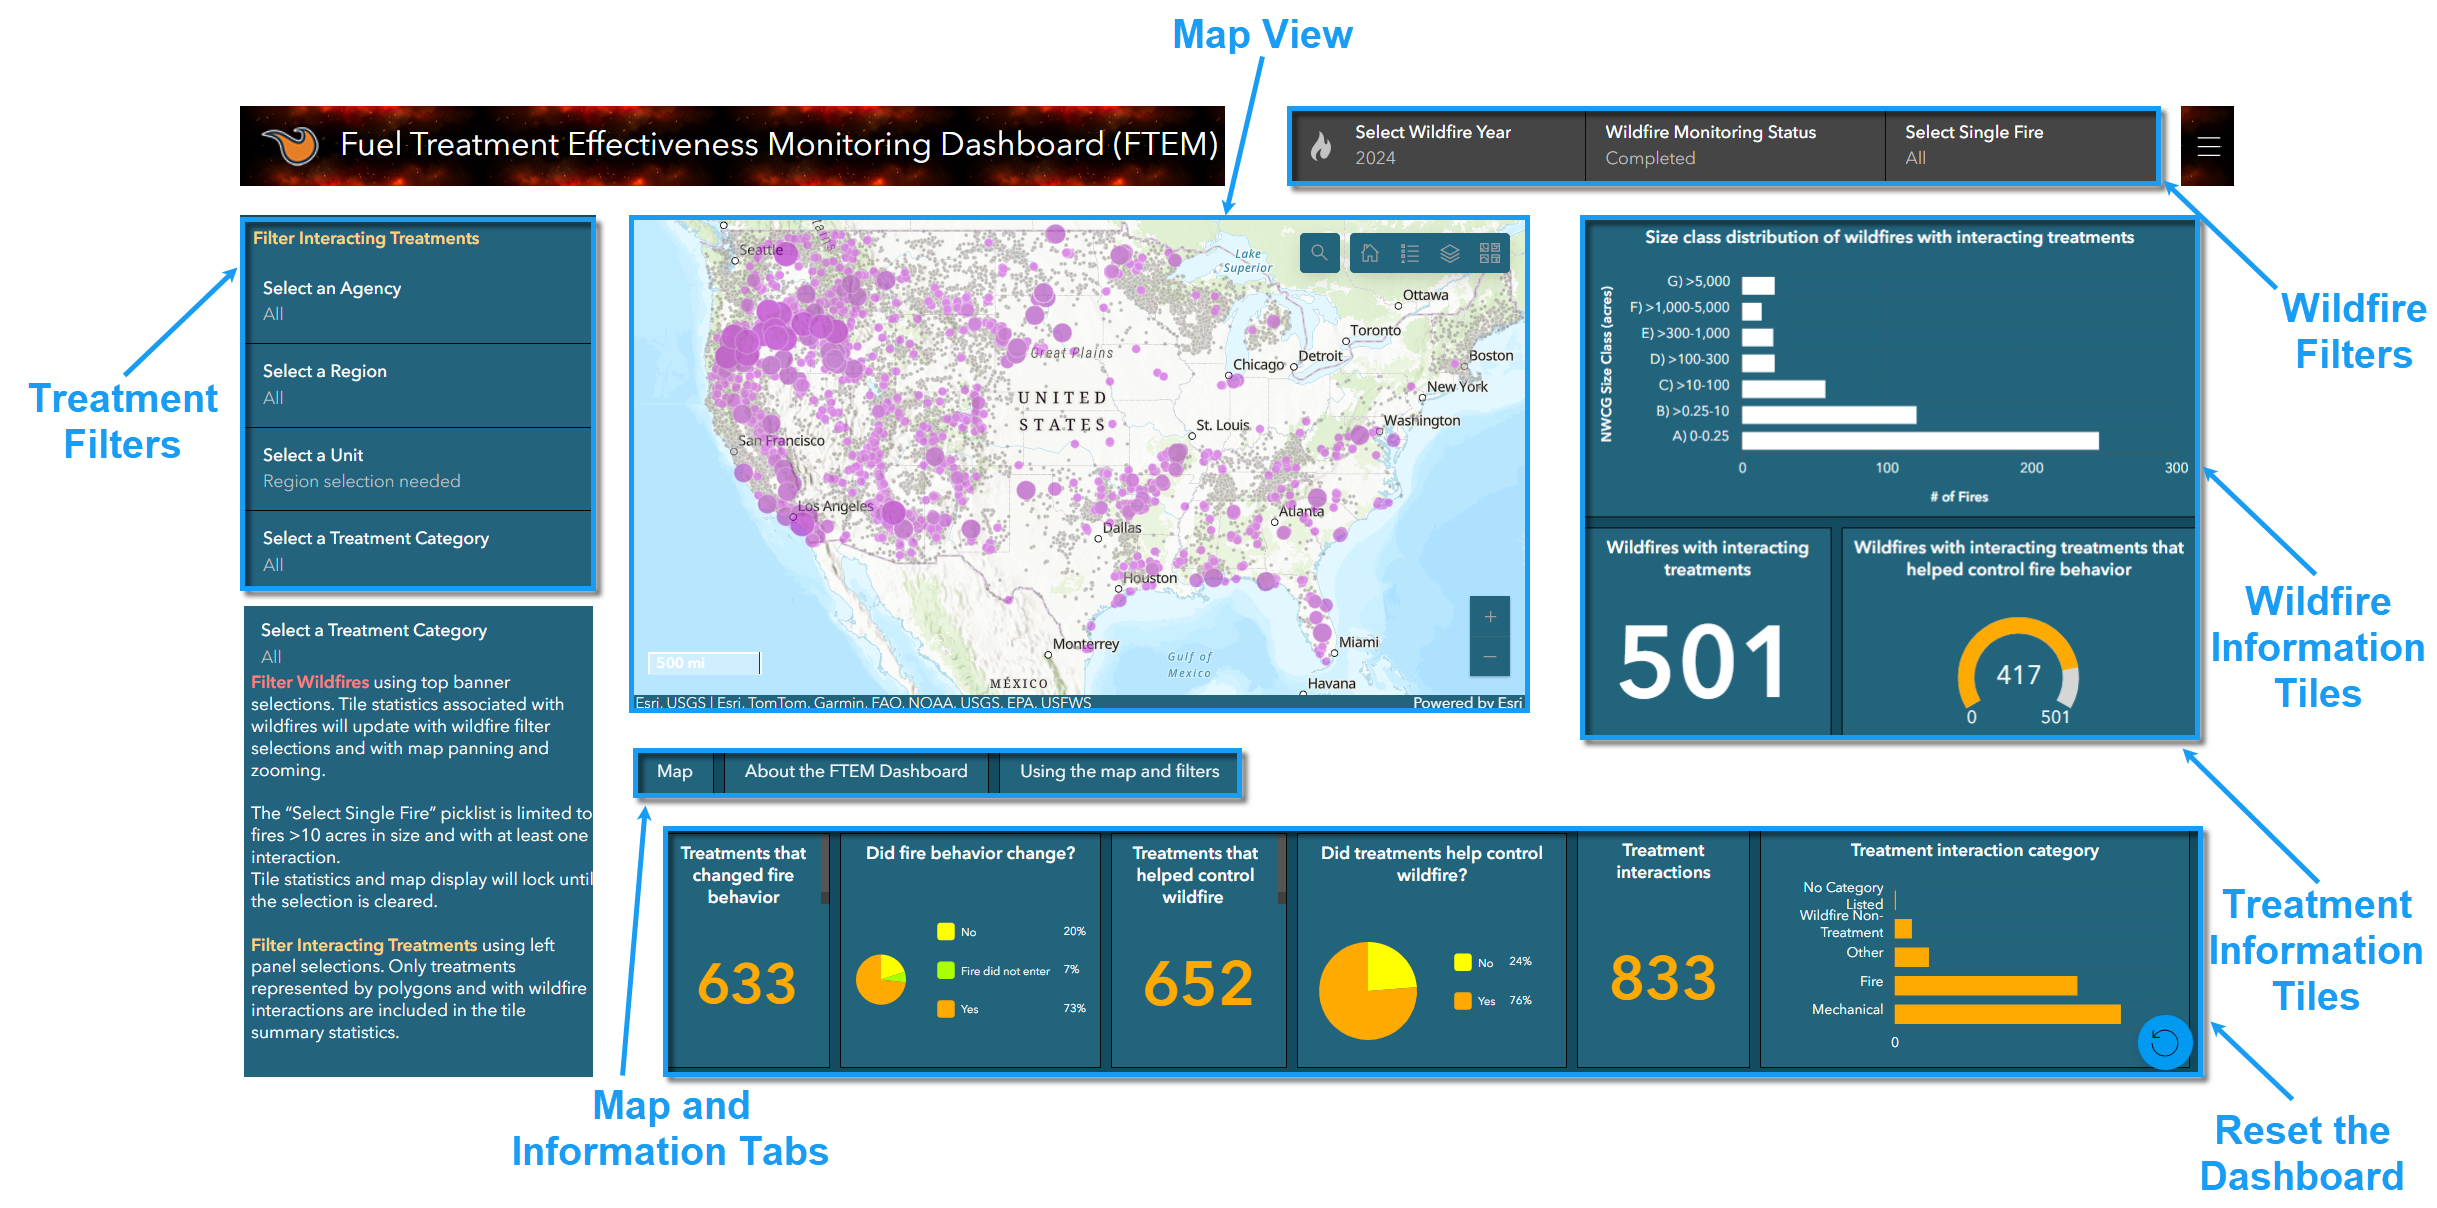
The Map View
Important! Information tiles dynamically update as you scroll around the map, but filter settings remain the same. Remember to double check the filter settings to ensure the desired data is being displayed.
The map display is color coded. Attributes include the following (see the map legend for all attributes)
-
Interactions: Upon opening the dashboard, wildfires with interactions are represented by purple circles, with circle size increasing with number of interactions. As the map extent narrows, the circles are replaced by wildfire polygons or points.
-
Wildfires: Purple polygons and points indicate wildfires with detected treatment interactions. Gray wildfire polygons and points have no treatment interactions.
-
Treatment interactions: Green indicates monitoring has been completed for that treatment interaction; yellow means monitoring is in progress; and red means that monitoring has not yet begun.
Examples of these, with the legend displayed, can be seen in the image below.
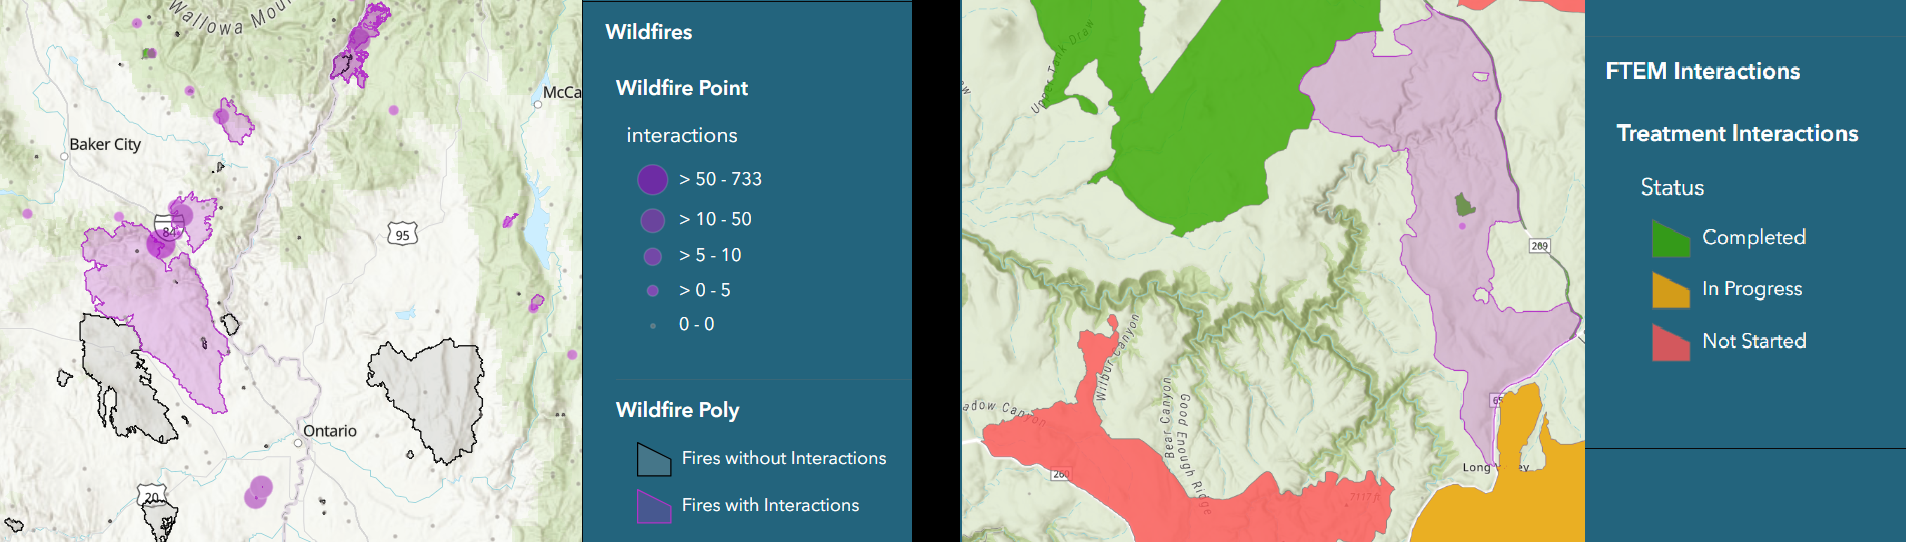
Tip: Optional layers can be toggled on or off in the legend. Use the search button to zoom to an individual fire.
Select a wildfire or treatment on the map to display an information window describing the selected feature. If multiple features geographically overlap, arrows will be present within the window to toggle between features. FTEM monitoring data are included as treatment attributes in this window, if they are available.
Filters
Data can be parsed in several ways using filters. Tiles with gold numbers provide information on treatments and tiles with white numbers provide information about wildfires. Agency regional boundaries can be turned on in the Layers list to help orient yourself to the treatment locations.
Interacting Treatments Filters
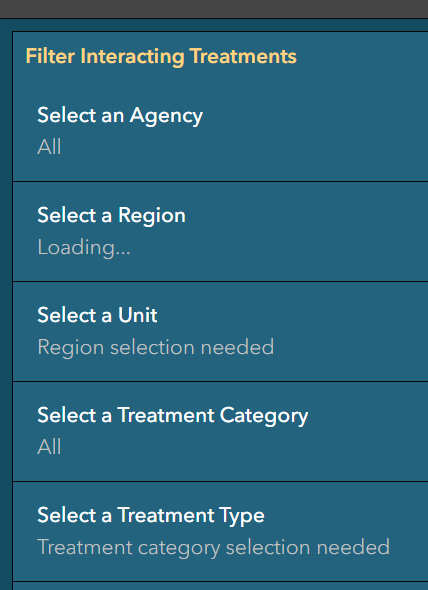
Filters show selections for which treatment information is available. Each filter option below is dependent upon the selection above it.
-
Select an Agency: Choose hazardous fuels treatments funded by USFS, BIA, BLM, NPS, USFWS or “All” for all agencies.
-
Select a Region: Jurisdictional region(s) for an agency or agencies.
-
Select a Unit: Jurisdictional units for a region(s).
-
Select a Treatment Category: Treatment category. Note that some agencies categorize treatments differently than others.
-
Select a Treatment Type: These choices are dependent on treatment categories. Only those categories that have been utilized on a selected unit will appear in the list.
Note: Filter choices with a large amount of data may create a delay in filter lists populating.
Wildfire Filters

-
Select Wildfire Year: Selecting a year will show all data for the year. The “year” refers to the year in which the wildfire started. To display data for all available years, select “All”.
-
Select Monitoring Status: Include all wildfires for the year selected based on wildfire monitoring status:
-
Not Started: One or more interacting treatments for the wildfire have been automatically detected by the system but they have not yet been verified or monitored by an FTEM Editor.
-
In Progress: One or more interacting treatments are in the process of being monitored by an FTEM Editor.
-
Completed: All interacting treatments have been monitored by an FTEM Editor.
-
All: Includes three wildfire monitoring statuses (Not Started, In Progress and Completed).
-
-
Select Single Fire: Use this selection to view data for a specific wildfire. This picklist is limited to fires over 10 acres in size with at least one interaction. Tile statistics and map display will lock until the selection is cleared.
Information Tiles
Wildfire Information Tiles
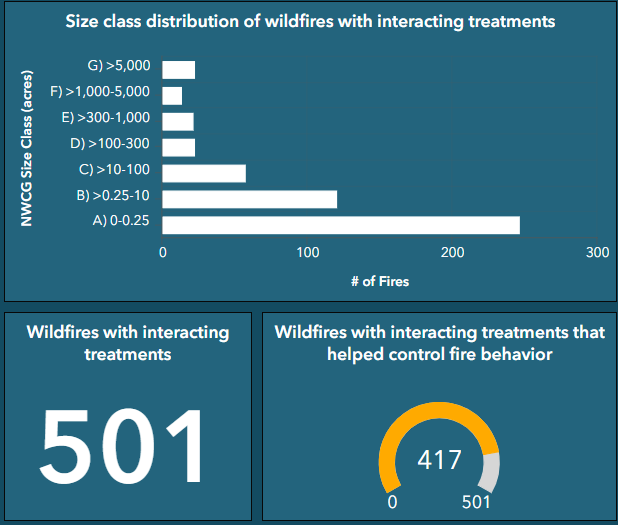
Size class distribution of wildfires with interacting treatments: Fire sizes for the selected filter criteria, based upon NWCG wildfire size classes.
Wildfires with interacting treatments: Fires matching the selected filter criteria in which interacting treatments were detected, regardless of whether the treatment helped control fire behavior.
Wildfires with interacting treatments that helped control fire behavior: Fires matching the selected filter criteria, in which interacting treatments helped control fire behavior.
Treatment Information Tiles
This panel provides interacting treatment statistics based on the treatment and wildfire filter selections.
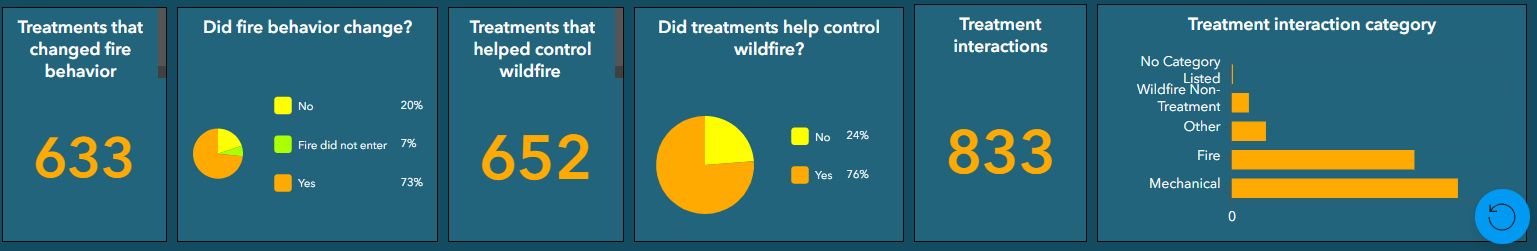
-
Treatments that changed fire behavior: The number of treatments that changed fire behavior.
-
Did fire behavior change? Pie chart view of treatments displaying those that changed fire behavior, in addition to those that did not change fire behavior or were not physically reached by a fire.
-
Treatments that helped control wildfire: The number of treatments that helped control the wildfire(s).
-
Did treatments help control wildfire? Pie chart view of treatments displaying those that helped control the wildfire alongside those that did not help control the wildfire.
-
Treatment interactions: The total number of treatment interactions detected, regardless of impacts on fire behavior or control.
-
Treatment interaction category: A graphical breakdown of the interacting treatments by treatment category. Treatment categories include Fire, Mechanical, Wildfire non-treatment, and for cases where no category was listed, “No Category Listed”.
Note: 0 and “No data” - If there were no recorded fires or interactions for the filter criteria selected, numbered information tiles will show a 0. Graph tiles are unable to function in this case and will display as “No data”
Additional Considerations
-
Some treatments may be larger than the map extent. In this case, the wildfires that interacted with them may not be in view but are still included in the statistics that relate treatments to wildfires. Change the map extent to see the entire treatment/wildfire interaction.