The Condition (Select a Classified Weather Stream) option in IFTDSS adjusts dead fuel moisture based on set scenarios.
Note: As of this version (3.12) of IFTDSS the only option is “Extreme,” which represents near-maximum or worst case conditions.
The Extreme weather stream (.wxs) data was derived from historic weather data used to model probabilistic wildfire risk components for the conterminous United States (Short and others 2016). To complete this modeling the conterminous United States was divided into 128 pyromes.
Note: Pyromes represent areas with similar fire characteristics which are determined by the fire regime (frequency, intensity, size, season, type, and extent), vegetation, and climate (Archibald and others 2013).
For each pyrome, historic RAWS data utilizing stations meeting quality assurance and currency requirements were analyzed to determine date ranges under which representative "extreme" or "near maximum worst case" conditions were encountered. The date range to use was determined by reviewing the daily ERC-G (Energy Release Component for NFDRS Fuel Model G) indices for the past 20 years and selecting a one to two week period where most of the days were at or above the 97th percentile. Below is an example of the Fuel Moisture Conditioning inputs that a user will see for a model run that was completed using the Classified Weather Stream option, it shows Pyrome Name as well as start and end date and time.
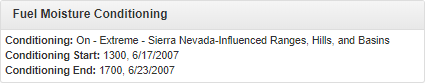
The conditioning period is unique for each pyrome; however, it always starts at 1300, which is the time when NFDRS calculates the initial fuel moistures. The initial fuel moistures used to determine the conditioning period are the same as the values used in the Automatic 97th Percentile Landscape Fire Behavior (Auto97th) Report. The duration of conditioning and the ending time was determined after running conditioning for several end dates and times. The dead fuel moisture grids were reviewed for site characteristics that match the RAWS location, typically cells with zero canopy cover and a similar elevation. Since 1-hour timelag fuels contribute most to fire behavior the priority was to match the 1-hour dead fuel moistures to the initial conditions. The 10-hour and 100-hour dead fuel moistures tend to be a little different from the initial conditions.
The conditioning weather stream is selected geographically based on:
- Identifying the center of the landscape extent.
- Calculating the distance from the center to the nearest Remote Automated Weather Station (RAWS) using a horizontal/vertical (elevation) algorithm.
- Ranking the stations and selecting the station which is the “closest” and has weather data requisite for running the model.
- Using the Extreme .wxs for the pyrome which contains the selected RAWS.
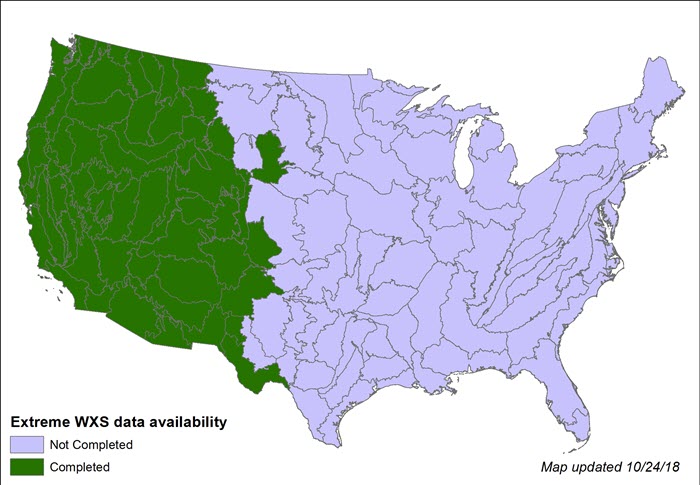
Not all locations will have Extreme .wxs data available. This is because:
- The data is limited to the conterminous United States.
- The weather stream data is under development.
- Some pyromes cannot condition to the leaf-off canopy cover for the 97th percentile ERCs.
- Significant non-burnable areas within pyromes negate the need for fire behavior modeling.
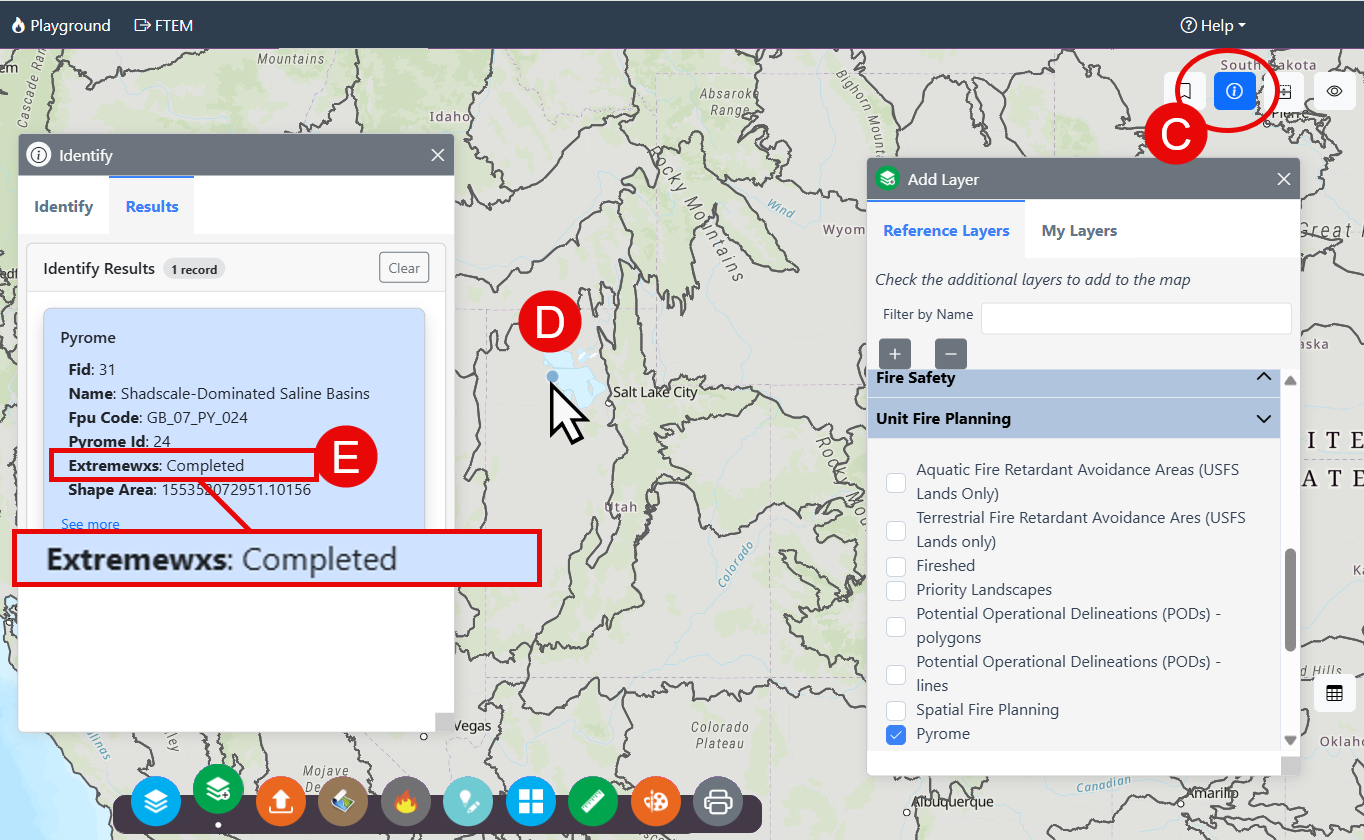
Checking a Pyrome for 'completion' with Map Studio in IFTDSS:
For those wanting to better understand the source of the classified conditioning data within IFTDSS, a reference layer within Map Studio allows you to view a map of the pyromes within the Continental US and Alaska. As shown in the map of pryrome earlier, some areas do not have pryome data. To view this layer in Map Studio, navigate to the approximate area in which you are working and follow these steps:
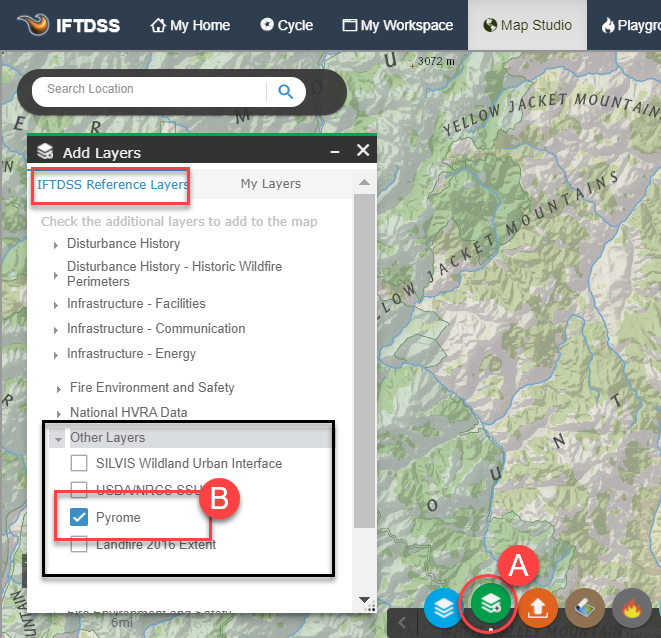
- Open the Add Layers widget
 .
. -
From the IFTDSS Reference Layers tab, scroll down and expand the “Unit Fire Planning” section and click the box next to “Pyrome”. You will notice several boundary lines appear on the map.
- Open the Identify widget
 in the top right of Map Studio.
 -
Click on your area and examine the data that appears in the Identify box.
-
Under the pyrome layer, if pyrome data is available for the area “ExtremeWXS” will show up as “Complete”. If “ExtremeWXS” is blank, there is not yet pryome data for the area.