Important! Different than FSim - IFTDSS LBP calculates burn probability and conditional flame length for a fixed set of weather conditions for a single burn period. The Large Fire Simulation Model (FSim, Finney and others 2011) used in many national, regional, and unit level assessments, calculates results based on variable weather inputs for fires burning multiple days throughout an entire fire season.
See the LBP technical documentation for more detail.
Burn probability is viewable in Map Studio, in Reports, and available in the download package. Burn probabilities represent the likelihood of a given location on your landscape burning. Burn probabilities are related to the sizes of fires that occur on a given landscape. Large fires produce higher probabilities than small fires. Since fire size is a function of both the rate of spread, and the duration of a fire, treatments or weather conditions that reduce the rate of spread will lower the burn probability.
Calculation
Within the LBP model, randomly located ignition points are used to simulate fires. Ignitions are only located and retained on burnable fuels, if an ignition is located on a non-burnable fuel it is discarded. The number of ignitions is determined by IFTDSS to most efficiently produce outputs for the user. See Number of Fires Simulated for details.
Quantifies the likelihood of a fire occurring under a fixed set of weather and fuel moisture conditions. It is calculated as:
Burn Probability = # times burned / total number of ignitions
For example, if the model ran 17,000 times and a pixel burned 1,462 times it would have burn probability of 0.086, (1,462/17,000=0.086). If a pixel burned 17,000 times in 17,000 fire simulations, it would have burn probability of 1.0, (17,000/17,000=1.0). If a pixel never burned during those 17,000 fire simulations, it would have a burn probability of 0 (0/17,000=0).
Display
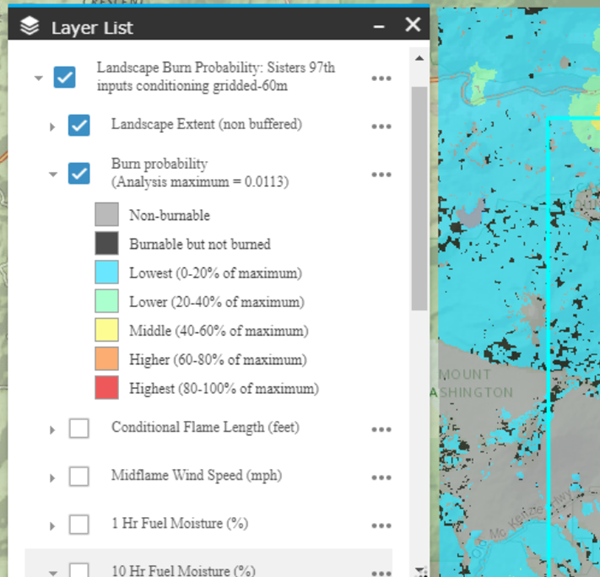
In the Map Studio and Reports parts of IFTDSS burn probability is displayed with 7 distinct classes. The first two are for pixels that did not burn:
- Non-burnable means that pixels have a non-burnable fuel model and cannot burn.
-
Burnable but did not burn means the pixel has burnable fuels but did not burn. This can be because a fire never reached the pixel, or a fire started within the pixel but it was unable to burn out of the pixel because the fire spread rate was too slow.
Note: Places on the landscape can be unburned for three reasons: 1) the location has a non-burnable fuel model, 2) fire never reached that location, or 3) an ignition started but did not burn out of the current pixel. These cases are presented differently in Map Studio and reports versus the GeoTIFF available for download. Non-burnable locations are denoted as such, “Non-burnable” in Map Studio and Reports, and are -1 in the GeoTIFF. Locations that the fire never reached or didn’t spread out of are “Burnable but not burned” in Map Studio and Reports, and are 0 in the GeoTIFF.
The remaining 5 classes are dynamic based on the maximum value of burn probability (noted in the map legend) within your analysis area. They include:
- Lowest (0-20% of maximum)
- Lower (20-40% of maximum)
- Middle (40-60% of maximum)
- Higher (60-80% of maximum)
- Highest (80-100% of maximum)
Each class represents equal interval steps of 20% of the analysis maximum burn probability. The advantage of this equal interval distribution is that it is unbiased in terms of category selection. Each category is given the same proportion of the range of values. It creates maps that are good for showing the values that are either over or under represented.
For a given area, the analysis maximum burn probability is determined based on what is displayed or reported. In IFTDSS there are three options for displaying the model outputs in Map Studio and two for Reports.
| Display Option | Map Studio | Report |
|---|---|---|
| Full extent of the model output, this includes the buffered area. | X | |
| Landscape extent (non-buffered), represented by the area within the turquoise box in map studio or the originally non-buffered extent of the landscape created (Default option for reports). | X | X |
| Area of interest, a shape or shapefile representing a smaller portion of the landscape. | X | X |
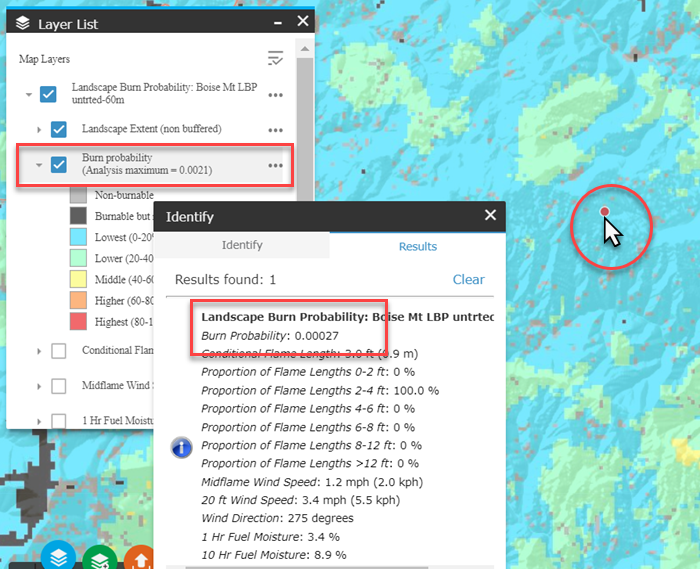
Burn Probability Classes are Scaled, use the Identify widget for more detail
The legend for Burn probability lists the “Analysis Maximum” for that analysis, the colored classes in the legend are scaled based on this value. The colored classes are not evenly distributed but rather are all in relation to the analysis maximum. As a result some analysis outputs may be heavily skewed to just one or two classes depending on the range of results. Each pixel has a unique burn probability which can be determined by using the Identify widget ![]() .
.
Note: In the IFTDSS download package, Burn Probability is represented by continuous values as a fraction. Where non-burnable pixels exist, the value is -1.