Exposure Analysis (EA) Reports
Note: Reports can summarize a maximum of 10 Primary HVRA Categories (the same limit that exists when creating HVRA Sets in the Map Values portion of IFTDSS).
Exposure Analysis (EA) Reports are generated from My Workspace (see Generating and Viewing Reports for instruction on how to create reports).
The EA reports summarize the burnable pixels within the HVRA Set, encompassed by the non-buffered landscape, or an area interest (AOI) within that non-buffered landscape, if an AOI is specified when requesting the report.
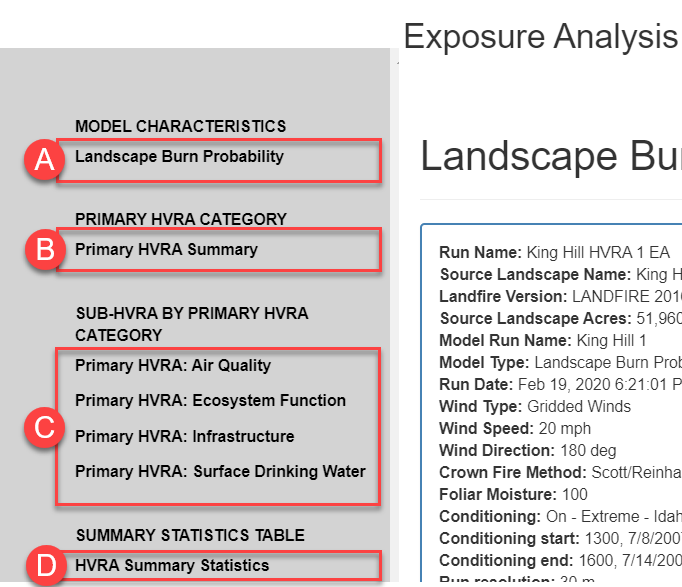
As seen in the image below, EA Reports have four primary sections, each is explained in more detail below:
- Model Characteristics - Landscape Burn Probability
- Primary HVRA Category - Primary HVRA Summary
- Sub-HVRA by Primary HVRA Category - Primary HVRA; Sub-HVRA(s)
- Summary Statistics Table - HVRA Summary Statistics
-
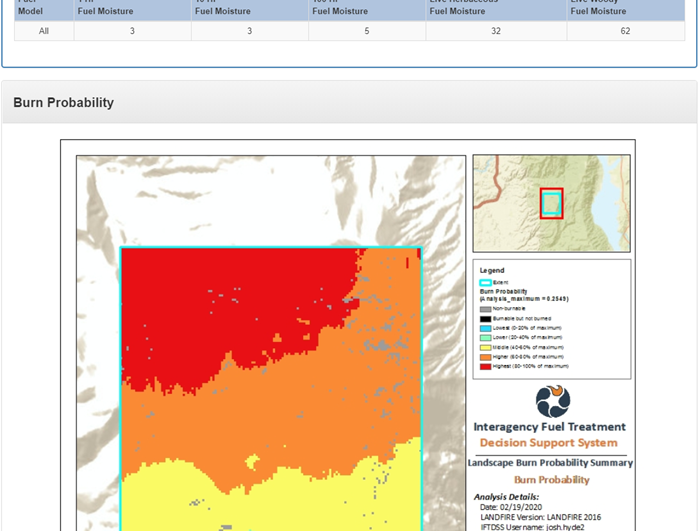
Model Characteristics: Landscape Burn Probability
The Landscape Burn Probability (LBP) section of the EA Report includes the header information with descriptive details about the run, followed by Landscape Burn Probability maps. The maps show the extent of three LBP outputs summarized in subsequent sections of the report: Burn Probability, Conditional Flame Length, and Integrated Hazard.
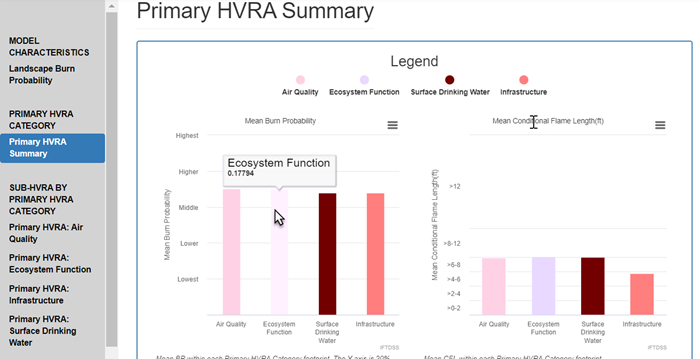
Primary HVRA Category: Primary HVRA Summary
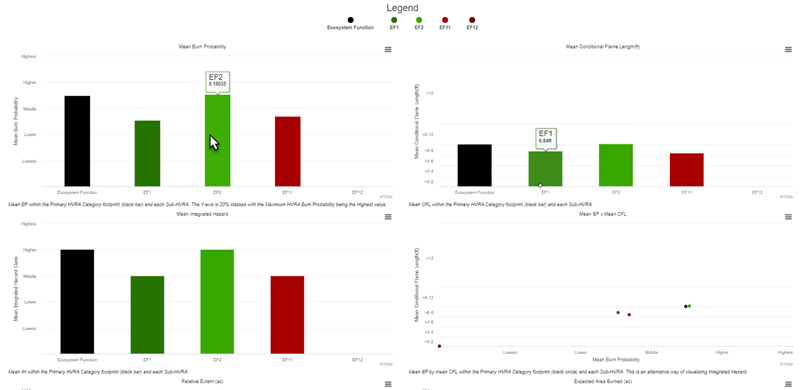
The Primary HVRA Summary presents bar charts and a table summarizing LBP outputs for burnable pixels within the extent all the Sub-HVRAs that make up each Primary HVRA Category. Results are shown for each Primary HVRA Category, with summary charts and tables including:
- Mean Burn Probability - Primary HVRA Categories are listed on the X-axis, and the Y-axis displays probability classes (lowest to highest in 20% increments). These classes are scaled based on the HVRA Maximum Burn Probability, which is the maximum value among all burnable pixels within the extent of all of the Sub-HVRAs within all the Primary HVRA Categories.
- Mean Conditional Flame Length - Primary HVRA Categories are listed on the X-axis, and the Y-axis displays mean conditional flame length. This graph summarizes the mean conditional flame length of all burnable pixels within the extent of each Primary HVRA Category.
- Mean Integrated Hazard Class -Primary HVRA Categories are listed on the X-axis, and the Y-axis displays the mean Integrated Hazard (IH) classes (lowest to highest in 20% increments). The Integrated Hazard classes are derived same methodology as implemented in LBP, applied to the scaled burn probability class from the top bullet.
- Mean BP x Mean CFL - A scatter plot displaying Mean Burn Probability on the x-axis and Mean Conditional Flame Length values on the y-axis. This provides another way to visualize Mean Integrated Hazard.
- Relative Extent - Primary HVRA Categories are listed on the X-axis, and the Y-axis displays the extent of coverage, in acres.
- Expected Area Burned - Primary HVRA Categories are listed on the X-axis, and the Y-axis displays the area expected to burn within the extent of each Primary HVRA Category. It is the product of Mean Burn Probability multiplied by Relative Extent.
Tip: Hovering over a bar or scatter dot displays the actual value it represents.
Note: A Primary HVRA Category with a value of zero for all the charts and the tables means all of the Sub-HVRAs with it fall fully outside of the analysis area summarized in the report.
Sub-HVRA by Primary HVRA Category
The Sub-HVRA by Primary HVRA Category section(s) of the EA Report includes a map of the Sub-HVRA(s) within the Primary HVRA Category, followed by bar charts and a table summarizing key outputs within the extent of the Sub-HVRA(s). The report shows this for all Sub-HVRAs within each Primary HVRA Category.
The map below shows all the Sub-HVRAs with a Primary HVRA Category, in this case Ecosystem Function.
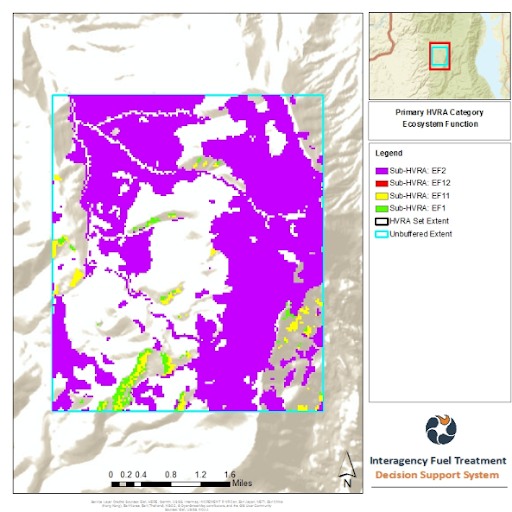
Note: Sub-HVRAs with a very small extent (i.e., structures, communication towers, trails) may be very difficult or impossible to see in the report map image.
In the charts and table for each Sub-HVRA Summary by Primary Category, summary statistics include:
- Mean Burn Probability - Sub-HVRAs are listed on the X-axis, and the Y-axis displays probability classes (lowest to highest in 20% increments). These classes are scaled based on the HVRA Maximum Burn Probability, which is the maximum value among all burnable pixels within the extent of the Sub-HVRA.
- Mean Conditional Flame Length - Sub-HVRAs are listed on the X-axis, and the Y-axis displays mean conditional flame length. This graph summarizes the mean conditional flame length of all burnable pixels within the extent of the Sub-HVRA.
- Mean Integrated Hazard Class - Sub-HVRAs are listed on the X-axis, and the Y-axis displays the mean Integrated Hazard (IH) classes (lowest to highest in 20% increments). The Integrated Hazard classes are derived using the same methodology as implemented in LBP, applied to the scaled burn probability class from the top bullet.
- Mean BP x Mean CFL - A scatter plot displaying Mean Burn Probability on the x-axis and Mean Conditional Flame Length values on the y-axis. This provides another way to visualize Mean Integrated Hazard.
- Relative Extent - Sub-HVRAs are listed on the X-axis, and the Y-axis displays the extent of coverage, in acres.
- Expected Area Burned - Sub-HVRAs are listed on the X-axis, and the Y-axis displays the area expected to burn within the extent of each Sub-HVRAs. It is the product of Mean Burn Probability multiplied by Relative Extent.
The value for the Primary HVRA Category is included in each of the charts listed above for visual comparison purposes. It is represented by a black bar (or black dot if used in a scatter plot).
Note: A Sub-HVRA with a value of zero for all the charts and the tables means it falls fully outside of the analysis area summarized in the report.
HVRA Summary Statistics Table
The HVRA Summary Statistics table at the end of the EA Report includes all the summary statistics in one place. It lists the values from the Primary HVRA Summary and Sub-HVRA by Primary HVRA sections of the report.
The default order in which the values are displayed is alphabetical, according to Primary HVRA Category. You may also sort this table by clicking on the column heading of interest. You may also download the table for use outside of IFTDSS.
Understanding Primary HVRA and Sub-HVRA Summary Charts
When interpreting EA reports and the charts contained in them, it helps to keep the following in mind:
- The Primary HVRA Category summary is a useful tool for generalizations about how Primary HVRA Categories relate to one another.
- Similarly, the Sub-HVRA by Primary Category charts are a useful tool for generalization about how the Sub-HVRAs within a given Primary category relate to one another.
- The scatter plot displaying Mean BP x Mean CFL provides another method of comparing integrated hazard. The lowest to highest classes displayed on the y-axis, but each point represents the specific mean BP and mean CFL values. This provides a more detailed way of visualizing and comparing integrated hazard.
- If you notice the charts portray less differentiation between HVRAs than you expected, keep in mind that the data represent the mean value for all of the pixels within the extent of Primary HVRA Category or respective Sub-HVRA(s), for the entire analysis area. For example, if a chart portrays the mean burn probability for Communication Towers as being higher than that of Pipelines, it does not indicate that all Communication Towers within the Infrastructure Sub-HVRA footprint have higher values than all Pipelines. It is portraying a mean of all burnable pixels within the extent of the Primary HVRA category or respective Sub-HVRA.
You can better understand the variation within a Primary HVRA Category by:
- Reviewing all the HVRA Summary Statistics table at the end of the EA report.
- View the Exposure Analysis output in Map Studio.
- Adjust the transparency in Layer List and use the Swipe widget to evaluate HVRAs on your landscape in relation to LBP model outputs.
- Use the Identify widget to view the burn probability, conditional flame length, and integrated hazard of individual pixels.
- Download the Exposure Analysis output and analyze it external to IFTDSS.