Exposure Analysis (EA)Technical Documentation
Mapping Sub-HVRAs for Exposure Analysis
For an Exposure Analysis (EA), the Sub-HVRA data from the HVRA Set is converted from a vector to a raster. The one exception is Ecosystem Function, which is a raster within IFTDSS. The resolution (a.k.a. pixel or cell size) will always be the same as the Landscape Burn Probability model output used to create the Exposure Analysis.The resulting raster (seen in Map Studio and available with the Download) represents the presence of the given Sub-HVRA for a location.
The following are examples of how Sub-HVRAs are converted from the HVRA Set to the Exposure Analysis version. The original source of the Sub-HVRA data does not matter (e.g. National HVRA Data, IFTDSS Reference Data, or User Created/Uploaded Data) but the type of data does (e.g. polygon, point. line, raster).
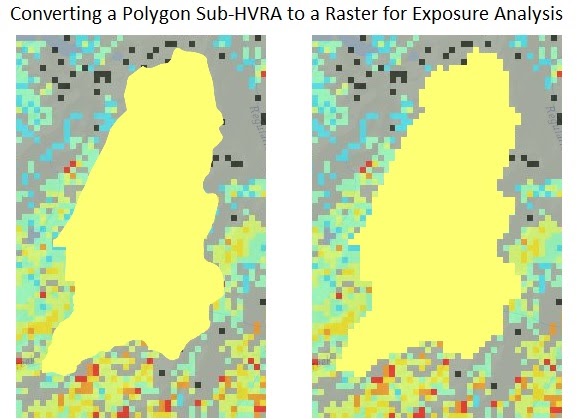
Converting Polygon(s) to Raster
When converting from a polygon to a raster, the pixels where the center point intersect the polygon are retained. Keep in mind raster cells are squares, so the resulting rasters will not be an exact match to the original polygon.
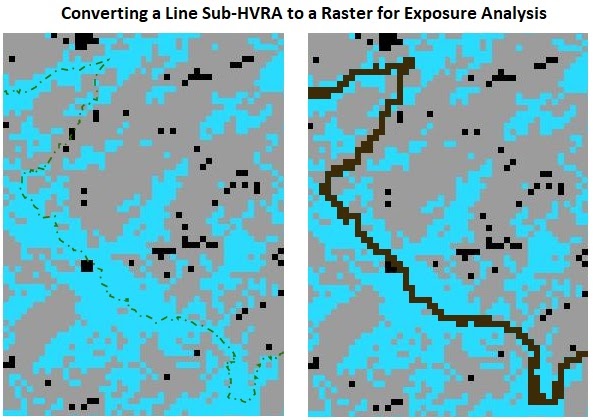
Converting Line(s) to Raster
When converting from a line to a raster, the pixels which intersect the line are retained.
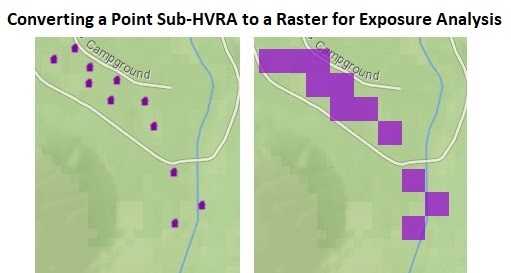
Converting Point(s) to Raster
When converting from a point to a raster, the pixels with points landing within them are retained. It is possible for there to be multiple points within a pixel; however, only one pixel is created.
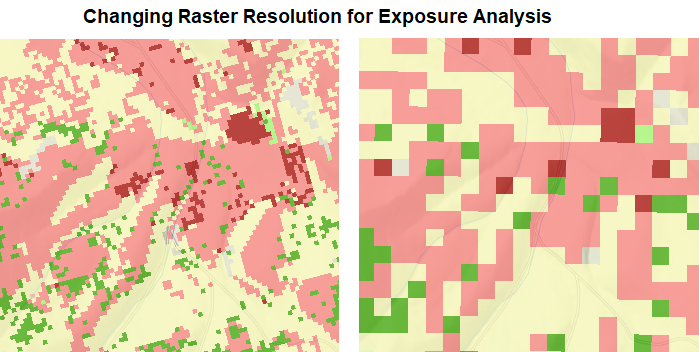
Changing Raster Resolution
When converting from a finer resolution raster to a courser one, the value at the centerpoint of the courser pixel is retained. In IFTDSS, the only data where this is the case is for Ecosystem Function, which is at 30 m, and Exposure Analyses can be at 30, 60, 90 or 120 m.
Generating Summary Statistics for Exposure Analysis Reports
The Exposure Analysis Reports include summary statistics calculated for both the Primary HVRA Category and for individual Sub-HVRAs grouped by Primary HVRA Category. When completing the summary statistics, only burnable pixels are used in the calculations.
The HVRA Maximum Burn Probability value, shown in the Landscape Burn Probability section of the report, is used to generate the Mean Burn Probability scale in the charts and to determine Mean Integrated Hazard. The HVRA Maximum Burn Probability is the maximum burn probability value amongst all burnable pixels that are within any Sub-HVRA. The HVRA Maximum Burn Probability may be identical to or different (always lower) than the Analysis Maximum Burn Probability depending on if the maximum value within the analysis extent is within a Sub-HVRA.