Expected Weighted Net Value Change Output
Tip: Trying to determine whether to use Conditional or Expected NVC? See the QWRA Considerations topic for more discussion on choosing between Conditional and Expected NVC. For details on how E(wNVC) is calculated, see the Technical documentation topic).
Expected Weighted Net Value Change (NVC), E(wNVC), brings the likelihood of a fire occurring into the analysis of the effects of fire on Highly Valued Resources or Assets (HVRAs). That is, E(wNVC), is the product of C(wNVC) and burn probability. It is used for planning scenarios where the likelihood of fire needs to be considered, as well as the threats and benefits. It is one tool available for determining where best to treat fuels or to allow for unplanned ignitions to reduce risk. It can address a situation such as, “how likely is it that a fire might occur and where, which areas are more likely to be impacted and how will the HVRAs be impacted (negatively and positively) when it does occur?”
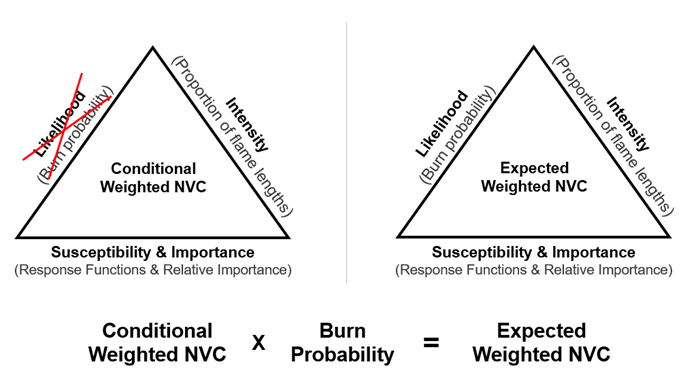
Expected Weighted NVC is calculated using the following:
- Burn Probability (from Landscape Burn Probability model output)
- Proportion of Flame Lengths (from Landscape Burn Probability model output)
- Sub-HVRA maps (from Map Values)
- Response Functions
- Relative Importance
- Relative Extent
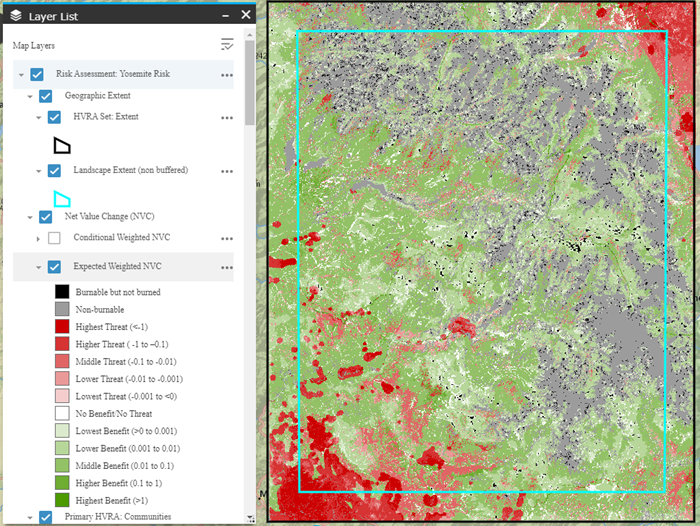
Expected Weighted NVC is calculated for every pixel and takes into account overlapping HVRAs. Positive values of E(wNVC) are considered benefits, negative values are considered threats. A value of 0 indicates there is neither threat nor benefit to the pixel burning. These zero values can occur for a few reasons, including:
- When no HVRAs are present.
- When fire burned at an intensity that only correlated to neutral Response Function (RF) values (i.e., only burned between 0-2 and 204 ft and the RF for those were 0).
- When the summation of NVC was zero.
The image below shows an example of Expected Weighted NVC in Map Studio with a range of values from negative (threats, indicated with a red color scheme), and positive (benefit, indicated by a green color scheme).