Comparing Added Treatments and Concluding
Before evaluating the reports, we'll do a quick comparison between the two treatment alternatives:
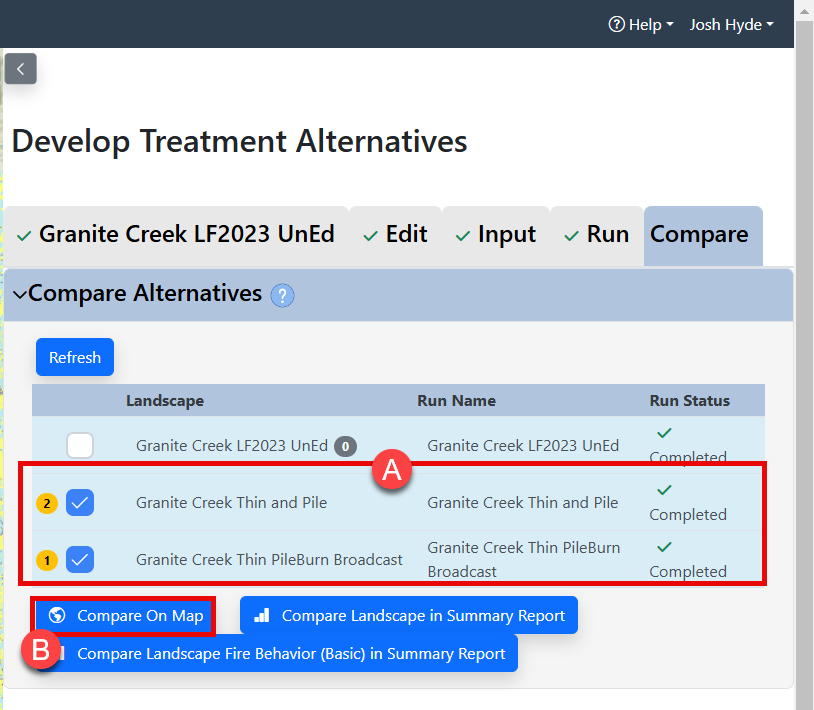
- Unselect both landscapes and select the following:
1. "Granite Creek Thin PileBurn Broadcast"
2. "Granite Creek Thin Pile Burn"
This will compare the earlier treatment, the thin and pile burn, with the new treatment, the thin and pile burn followed by a broadcast burn.
-
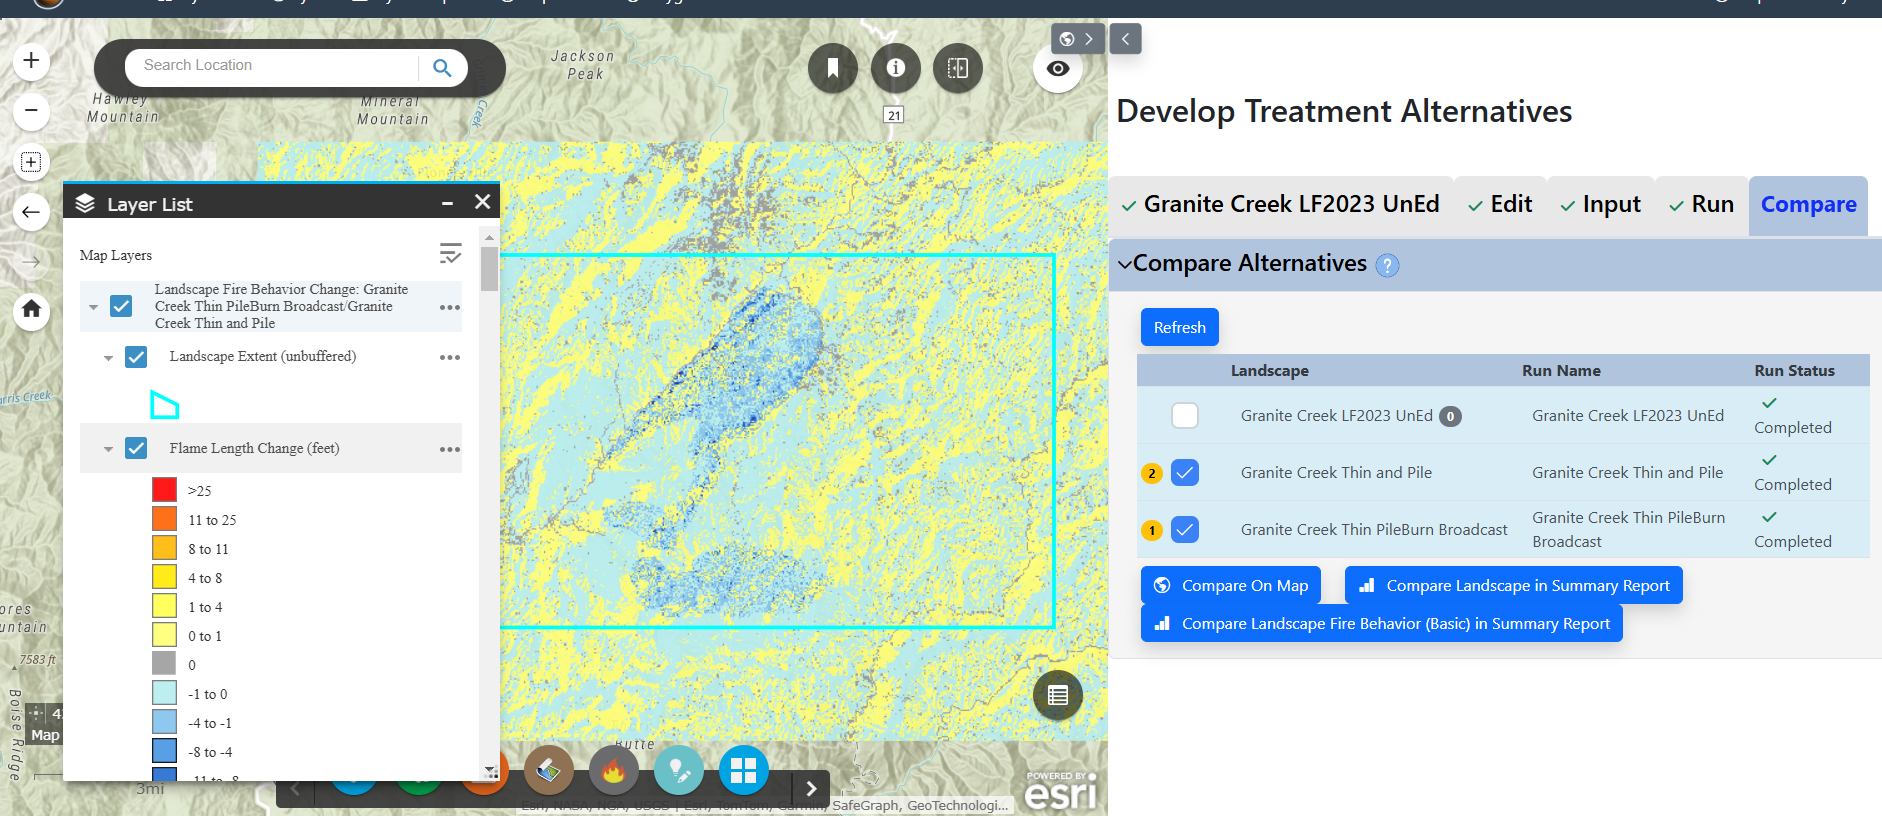
Select Compare on Map and view the fire behavior layers produced in the Layer List. Checking the fire behavior layers from the Layer List, we see that flame lengths are modeled to be lower on the landscape which has also had a broadcast burn.
-
Evaluating the fire behavior and flame length, we see a lot of blue shading within the treatment areas, indicating that a broadcast burn is modeled to further reduce flame lengths. Turning flame lengths off and turning on rate of spread shows a similar trend.
-
Next, use the Compare Landscape in Summary Report and Compare Landscape Fire Behavior (Basic) in Summary Report buttons to create a set of comparison.
Review summary reports
-
When the Compare Landscape Fire Behavior (Basic) in Summary Report is finished, select View Report.
-
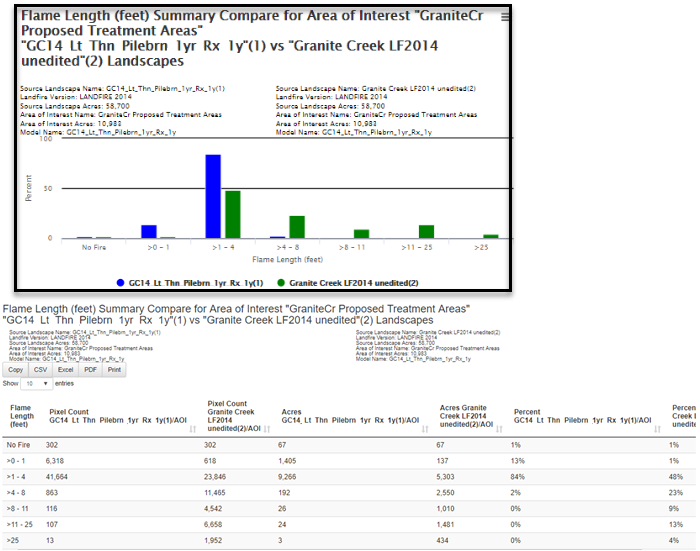
The table for flame lengths indicates a further reduction in flame lengths, where as 0-1 foot and 1-4 foot flame lengths were 18% and 63% respectively, the post treatment flame lengths for the new treatment have shifted to 61% and 32%. Scrolling through the report, rates of spread have also been reduced.
-
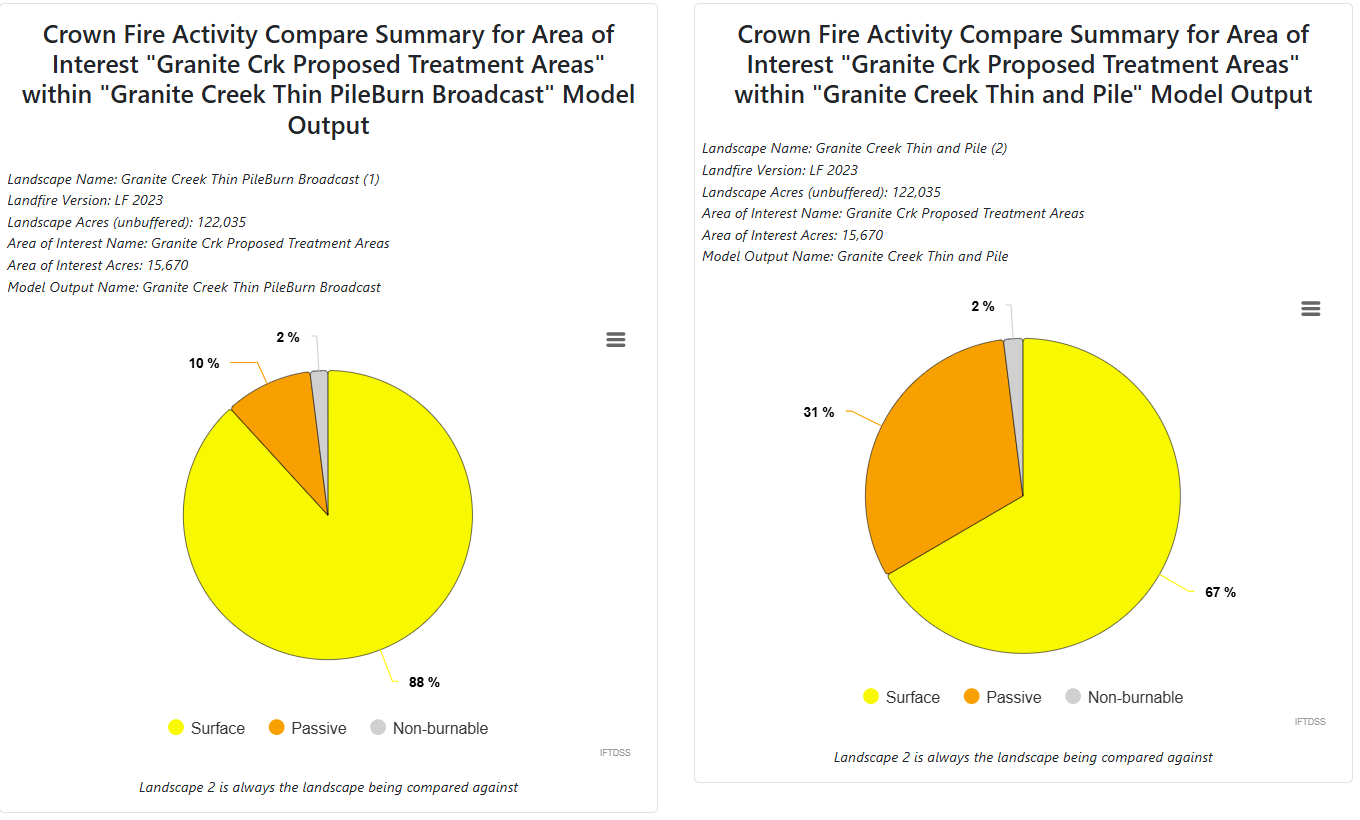
Scroll through the rest of the fire behavior model outputs in the report. Their story is the same, reduced rates of spread, as well as almost no crown fire activity post-treatment.
The pie charts tell the same story, plainly showing the shift to significantly lower flame lengths in the post-treatment chart.
Conclusion
You could continue this process and model a more invasive treatment, such as heavier thinning or increased mortality from a more severe broadcast (prescribed) burn, but these results achieve your initial preliminary objectives, and are a good place to start with a project proposal for the District ID Team.
From this process, it’s clear that the expected fire behavior, given 97th percentile fire weather and fuel moisture conditions, in the identified treatment areas is much more intense than what would be considered characteristic in this frequent, but low intensity, fire regime. The reports and maps demonstrate how these proposed treatments help achieve the preliminary objectives to reduce surface fuel loading and the overall horizontal and vertical fuelbed continuity, as well as helping to return low intensity fire in these treatment areas.