Developing Treatment Alternatives - Colville National Forest Example
Section 7– Comparing Added Treatments and Concluding
As before, select the model change layer to evaluate flame length reduction. What you’ll really want to know is how much of an effect this added treatment of low severity wildfire, or a broadcast burn, will have compared to just the light thinning and pile burn applied earlier. You’ll need to compare the first treatment to the second one to answer this.
Swipe between layers
In the map view, turn on the fire behavior layers and swipe between them with the he Swipe widget ![]() to better view the fire behavior geospatially for the two treatments:
to better view the fire behavior geospatially for the two treatments:
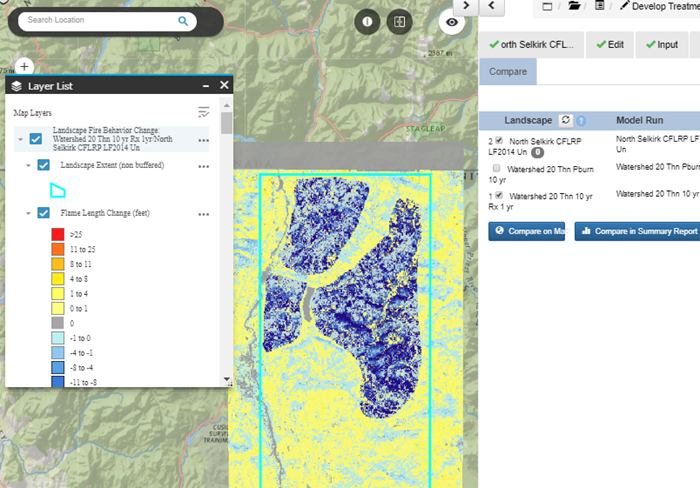
- from the Layer List widget
 , uncheck the "Landscape Fire Behavior Change" layers, and check the two "Landscape Fire Behavior" layers to turn them on.
 -
Use the Swipe widget
 to toggle between the two layers, checking and unchecking features such as flame length and rate of spread.
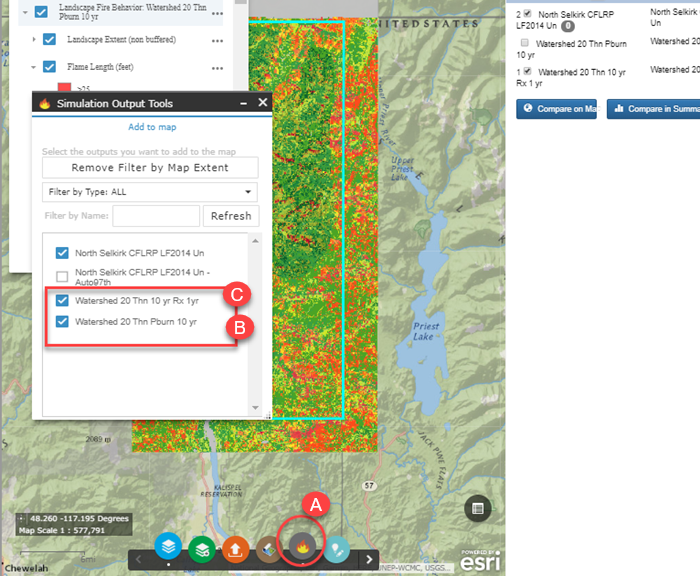
Swipe between the layers and compare: In this example, "N Selkirk Thin Pile Burn 10yr" is shown as the top swipe layer, followed by "N Selkirk Broadcast Burn". Sliding back and forth and looking at the legend indicates that the Flame Lengths were in fact reduced by several feet in some areas with just the addition of the broadcast burn!
Review Summary Reports
Next, open the Landscape Fire Behavior comparison report to get the full picture and make a more informed decision about what treatments should be applied to achieve the preliminary objectives.
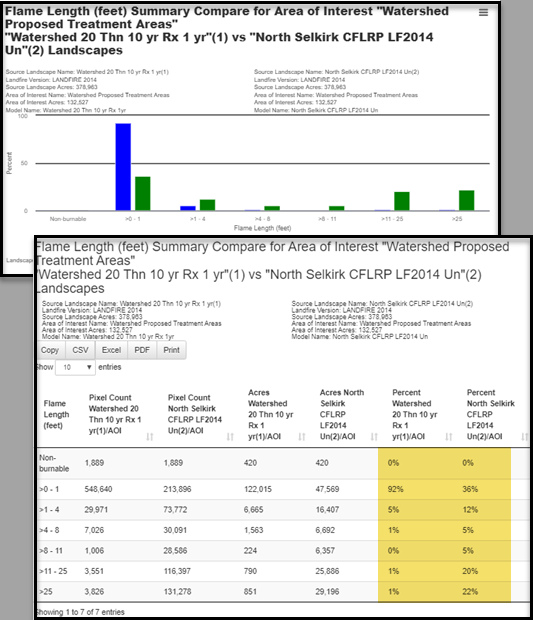
In the comparison report, the Flame Length bar chart shows an increase in the post-treatment acreage for lower Flame Length bins and no post-treatment acres in the higher Flame Length bins.
The table indicates the percentage of pixels in the >0-1 foot Flame Length bin has increased, from 71% for thinning and pile burning alone, to 96% when a broadcast burn was simulated on that thinned and pile burned landscape.
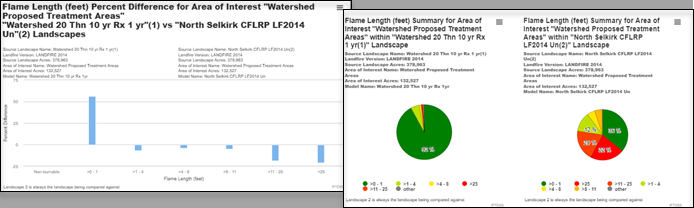
Rates of spread show a similar reduction in rates of spread displayed in the bar graph and table, as well as a percent difference graph and pie chart.
Scroll through the rest of the fire behavior model outputs in the report to view fireline intensity and heat per unit results. Their story is the same, with a reduction in fire behavior following the broadcast burn.
These outputs further justify the fact that this series of treatments will help achieve the stated objectives for this North Selkirk study area.
Conclusion
Based on Forest Plan direction and the CFLRP proposal guidelines, the preliminary results of this study show that we are meeting our objectives for the North Selkirk Project Areas, which are to:
- Recommend hazardous fuels treatments that can occur through this project to: Reduce the risk of uncharacteristic wildfire and/or re-establish or maintain low-severity fire regimes; reduce surface fuel loading and the overall horizontal and vertical fuel bed continuity to reduce the fire hazard to adjacent private, Tribal, and State land; and return low intensity fire to fire adapted vegetation communities.
- Locate areas where our actions will be most effective.
- Evaluate what type of treatment will help achieve these objectives.
- Describe why the treatment acres were chosen. Why here? Why now? What risk assessment did you use to identify these areas, e.g. wildfire hazard potential map or regional risk assessment, forest-wide risk assessment, etc.
- Demonstrate the need for treatment, both quantitatively and spatially, to members of your Forest Natural Resources Staff Officer and district interdisciplinary (ID) team.
This study was modeling more extreme fire behavior, given 97th percentile fire weather and fuel moisture conditions used, than the low-intensity/moderate-severity fire the study area typically sees in this portion of the Colville National Forest. This will help to justify future treatments during increasingly dry and hot sea-sons predicted for the future. You have set the foundation for a good report to give to your FLT and, if necessary, can go back and test out different treatment methods, such as a heavier thinning or increased mortality from a more severe broadcast burn.