Developing Treatment Alternatives - Colville National Forest Example
Section 6 – Comparing and Adding Treatment Alternatives
Comparing the Alternatives
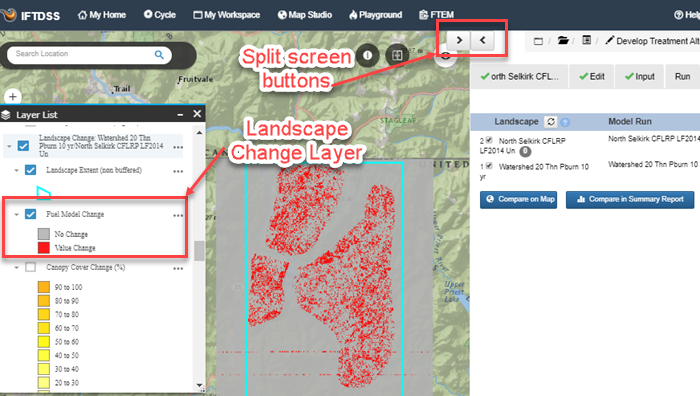
After clicking Compare on Map, the map appears in splitscreen mode. This allows you to view information from each tab on the right side of the screen, while allowing you to view “My Map” on the left. You can open or close this feature anytime by selecting the opposing arrows icon at the top of the screen.
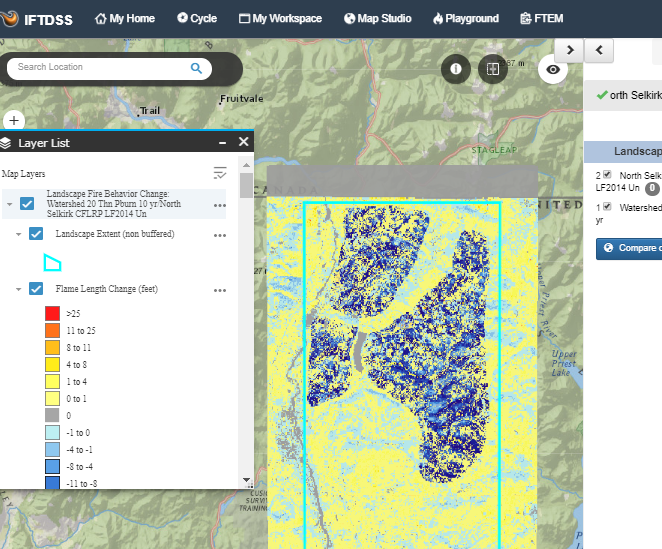
For example in the Layer List, turn on “Landscape Fire Behavior Change: N Selkirk Thin Pile Burn 10yr /North Selkirk CFLRP LF23 UnEd.” Next turn on Flame Length Change (ft). This layer shows the difference between post-treatment and pre-treatment Flame Lengths. With a glance, you can see that all the dark blue showing on those South/North Facing slopes that had initially shown very high flame lengths, are now indicating significantly decreased flame lengths and fire intensity.
Tip: The change map is generated on the fly. To access the map later you can select the landscape in the Develop Treatment Alternatives task, and click through each tab to get back to this point.
Turning off the Landscape Fire Behavior Change layer and turn on the Landscape Change layer and check the box next to “Fuel Model Change.” You can see a basic change map showing pixels in which the fuel model has changed.
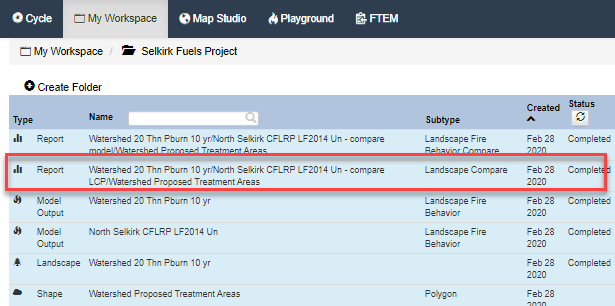
To access the summary reports, you can either find them in your project folder in My Workspace, or click the Compare in Summary Report button again and click on the links displayed in the pop-up box.
Go to My Workspace, locate “N Selkirk Thin Pile Burn 10yr /North Selkirk CFLRP LF23 UEd - compare model,” right click the file and select View Report to open the comparison report.
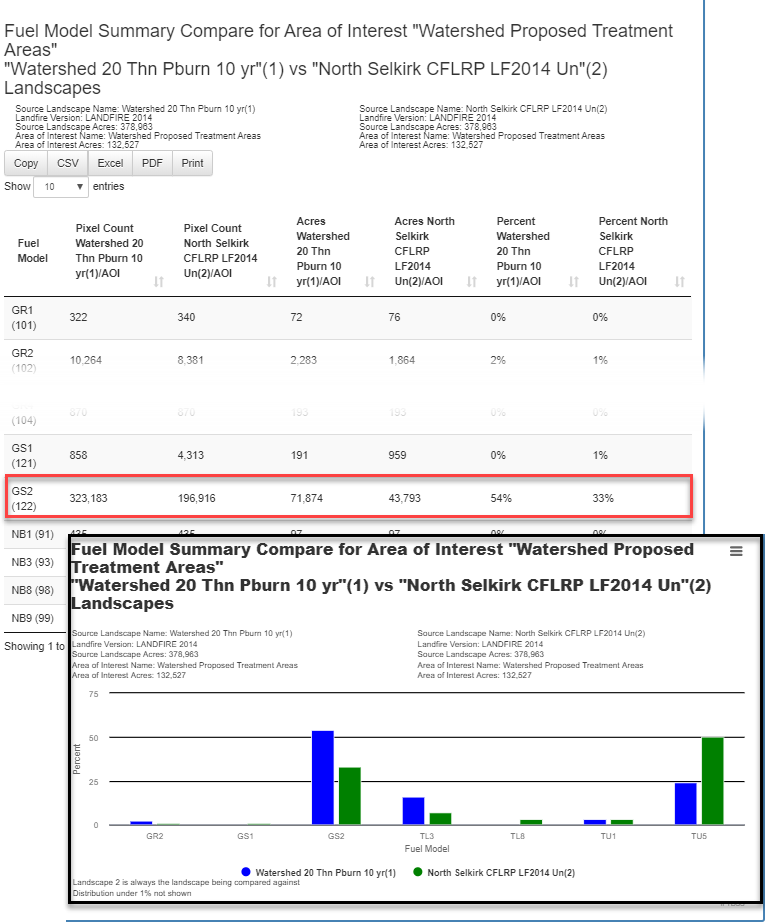
In the first bar graph, note the acreage for the AOI is displayed. This is a quick way to confirm the Develop Treatment Alternative task and resulting reports were actually run to quantify only the AOI, not the entire landscape.
Each fire behavior feature has a section of the report, starting with Flame Length. Note the side by side bar chart for flame lengths where green correlates with pre-treatment behavior, while blue indicates post-treatment results in the bar chart. You can see from this bar chart that the number of acres in the lower Flame Length bins goes up post-treatment, while the number in the higher Flame Length bins goes down, indicating a decrease in higher Flame Length post-treatment. Scrolling further down you’ll find these results in a table format as well, clearly showing the acres shifting toward the lower flame length bins, post-treatment.
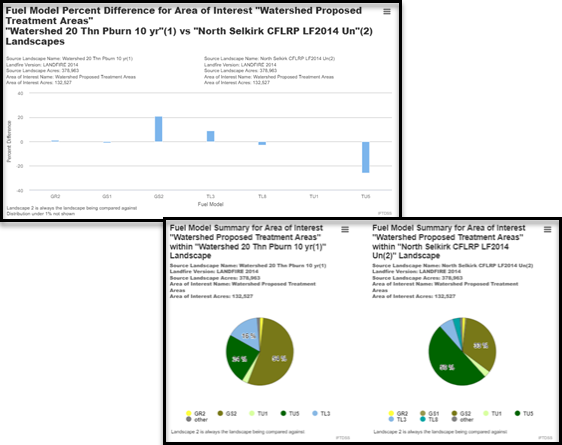
The Percent Difference Graph for Flame Lengths demonstrates the shift towards lower Flame Lengths post-treatment. You can see the positive percent difference in the 0-1 foot bin, while the bins correlating to higher Flame Lengths indicate a drop in the percent difference. The pie charts tell the same story, plainly showing the smaller sections of red/orange/yellow in the post-treatment chart.
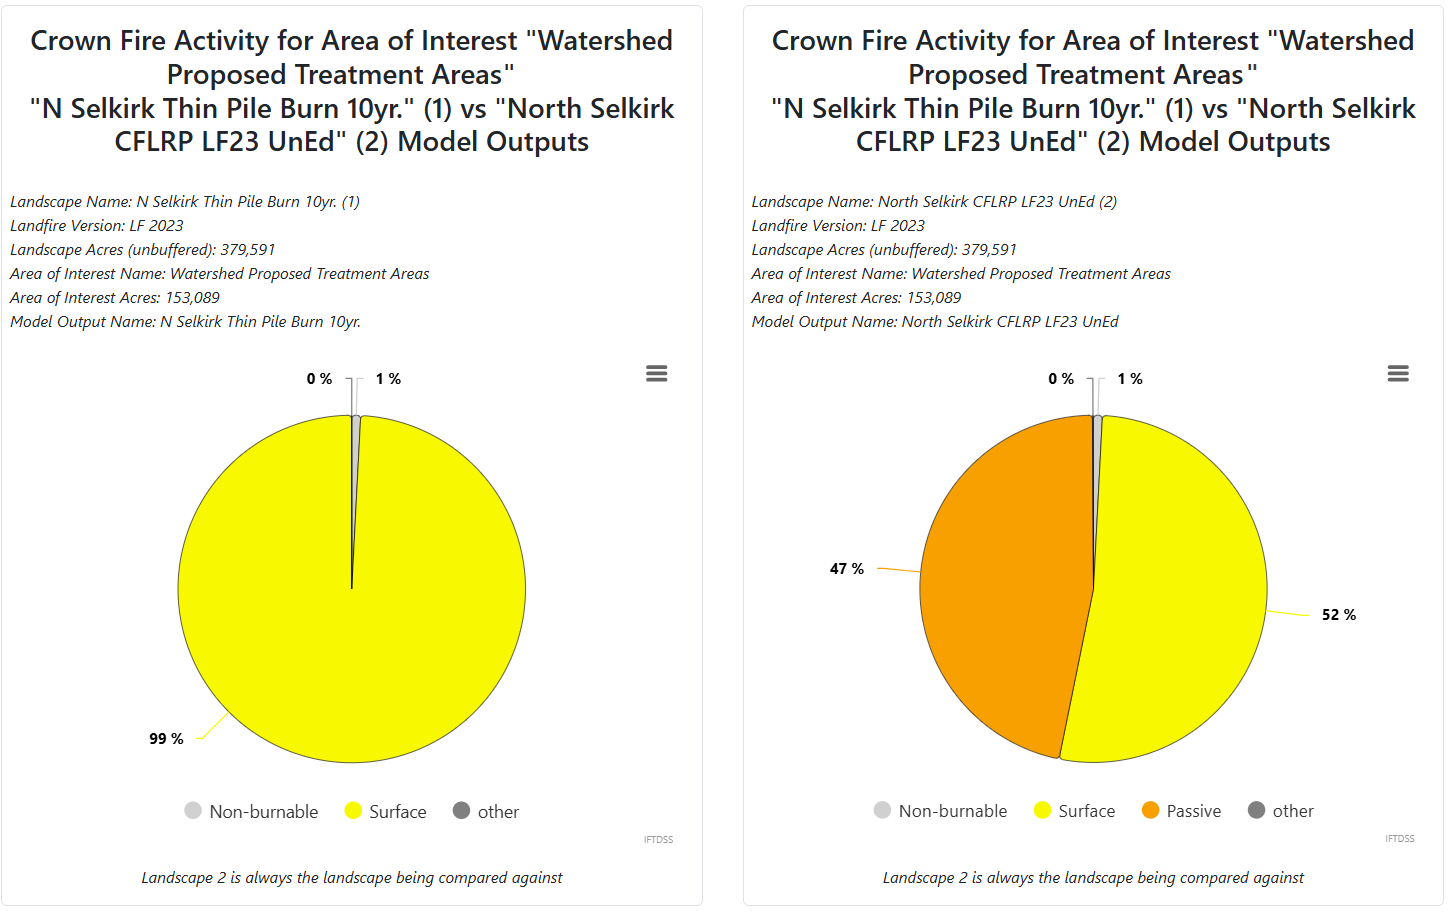
Scroll through the rest of the summary report to view the other fire behavior characteristics, such as the reduction in modeled crown fire activity following the treatment.
Tip: Note the values in your report may vary slightly from the ones we're about display. This is because the area of interest you drew at the beginning at this tutorial won't exactly match the one we drew here.
Adding an Additional Treatment to Treatment Alternatives
Now you’ll look at the effects of applying a subsequent broadcast burn after the light thinning/pile burning. One of the initial objectives is to re-introduce low intensity fire in this area and it’s an important step in treating this landscape. Additionally, you can see how this follow-up treatment will affect modeled fire behavior. In this treatment, the tree and canopy features will remain unchanged, and we’ll focus on a fuel model change to represent conditions following a low intensity prescribed fire in which the moderate grass/shrub areas have been reduced.
- Navigate to the Develop Treatment Alternatives workflow again and select the same Originating Landscape and AOI.
-
Navigate to the Edit Landscape tab.
-
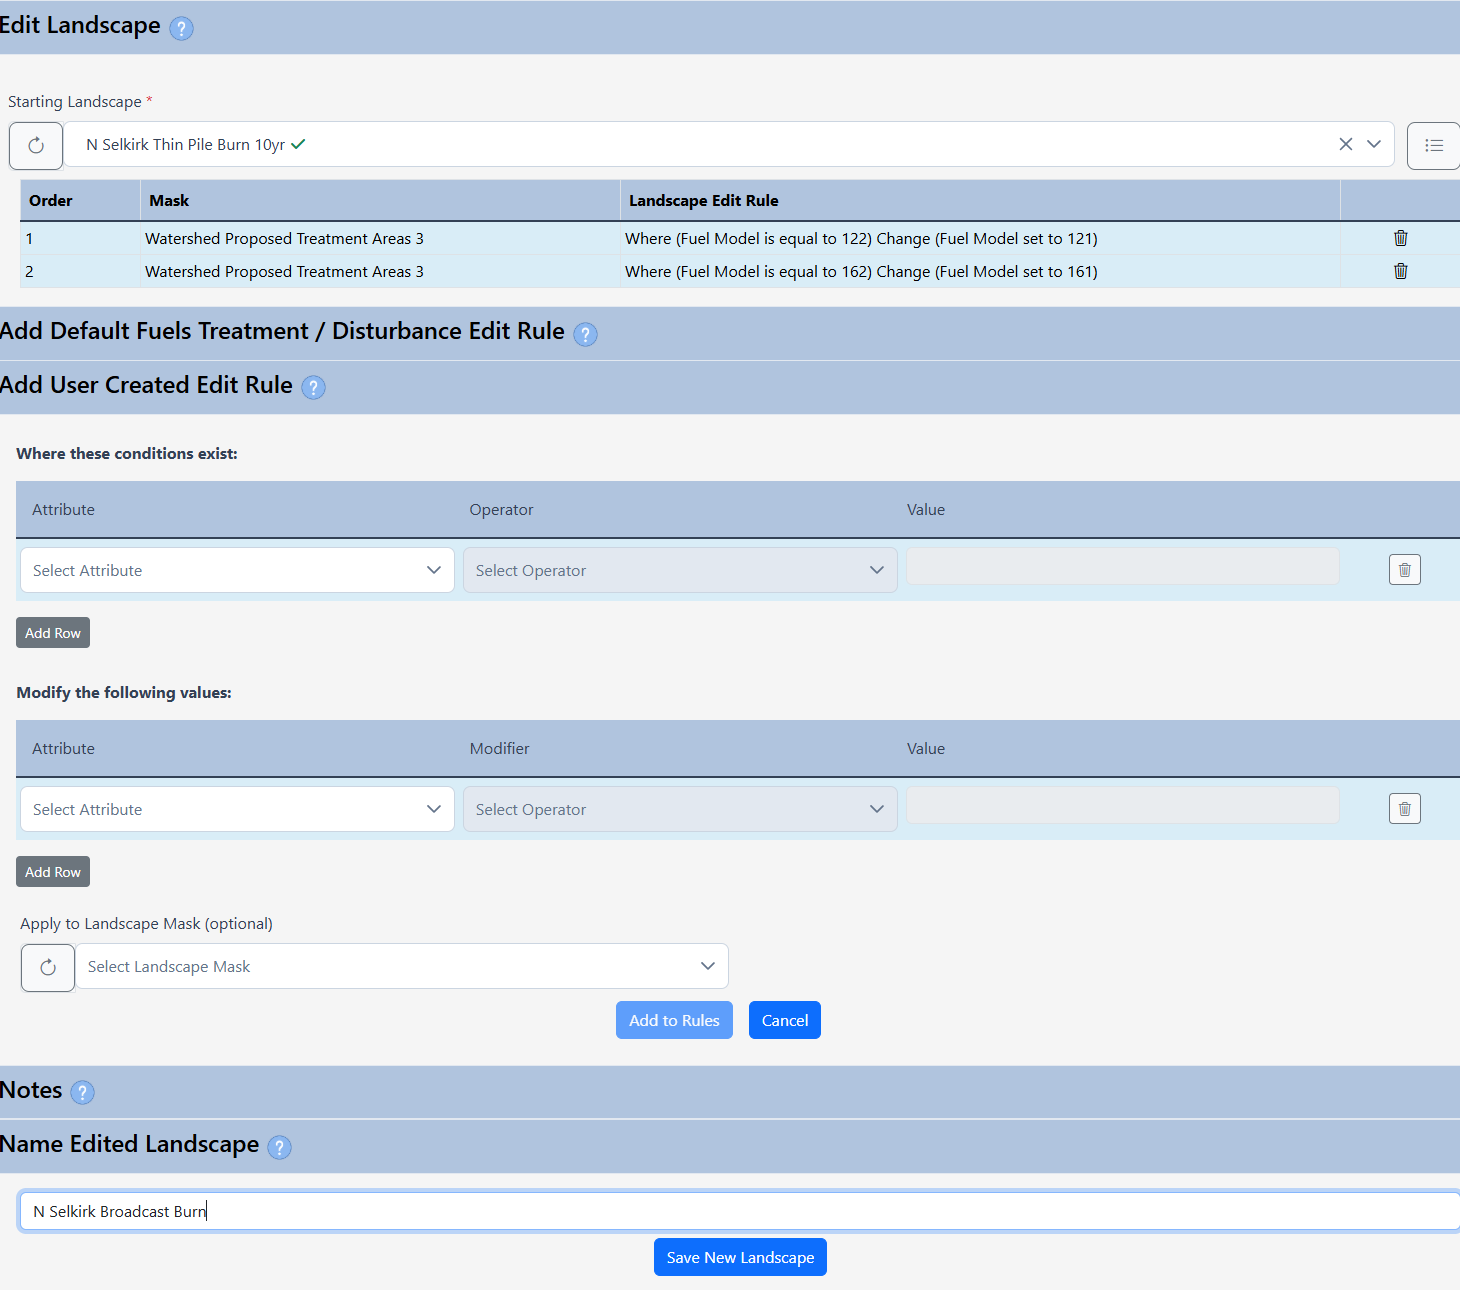
This time, choose the landscape with your earlier edits as the Starting Landscape: “N Selkirk Thin Pile Burn 10yr.”
-
Create a rule that will represent the landscape post prescribed broadcast burn that will change moderate grass and timber fuel models lighter grass and timber fuel models:
Landscape edit rules. Order Mask Landscape Edit Rule Explanation
1 Watershed Proposed Treatment Areas Where (Fuel Model is equal to 122) Change (Fuel Model set to 121) Changing fuel models to produce an overall reduction in all surface fire behavior categories.
2 Watershed Proposed Treatment Areas Where (Fuel Model is equal to TU2) Change (Fuel Model set to TU1) Apply these rules to Watershed Proposed Treatment Areas then select Add to Rules.
-
After the rule is added, give the landscape a detailed name (N Selkirk Broadcast Burn) and click Save New Landscape.
Skip the Model Input tab this time. That input was saved from your last run, and the weather parameters must be kept constant in order to compare the results of the landscape changes.
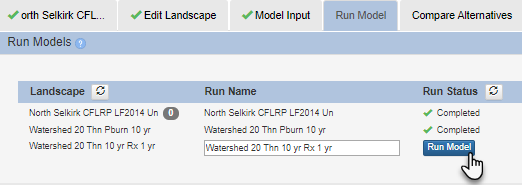
Go to the Run Model tab and click Run Model. You may need to click the Refresh button next to Landscape if your edited landscape is still being built.
Go to the Run Model tab and click Run Model. You may need to click the Refresh button above the model list if your edited landscape is still being built.
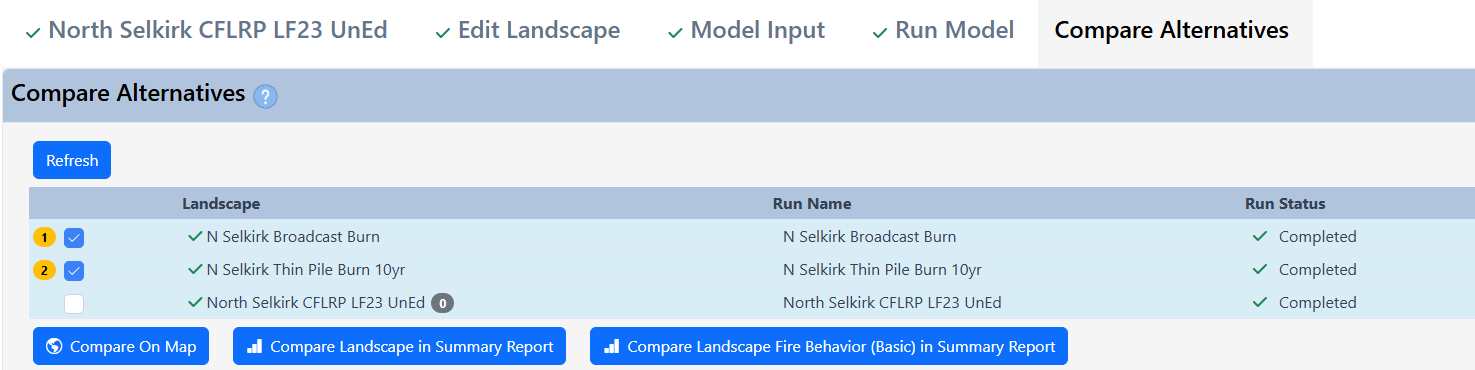
Next, move to the Compare Alternatives tab.
Compare the original landscape with this new one by selecting:
-
“N Selkirk Broadcast Burn” as landscape “1”.
-
Select “N Selkirk Thin Pile Burn 10yr” as landscape “2”.
-
Create a comparison summary report for both landscape and fire behavior results, as you did earlier in this tutorial.
-
Click Compare on map to get a map view of your changes.