Introduction
Quantitative Wildfire Risk Assessment (QWRA) reports are generated from My Workspace (see Generating and Viewing Reports for instruction on how to create reports).
Report Sections and Examples
QWRA reports have four primary sections, listed below.
- Conditional Weighted Net Value Change (NVC)
- Expected Weighted Net Value Change (NVC)
- Response Functions
- Relative Importance
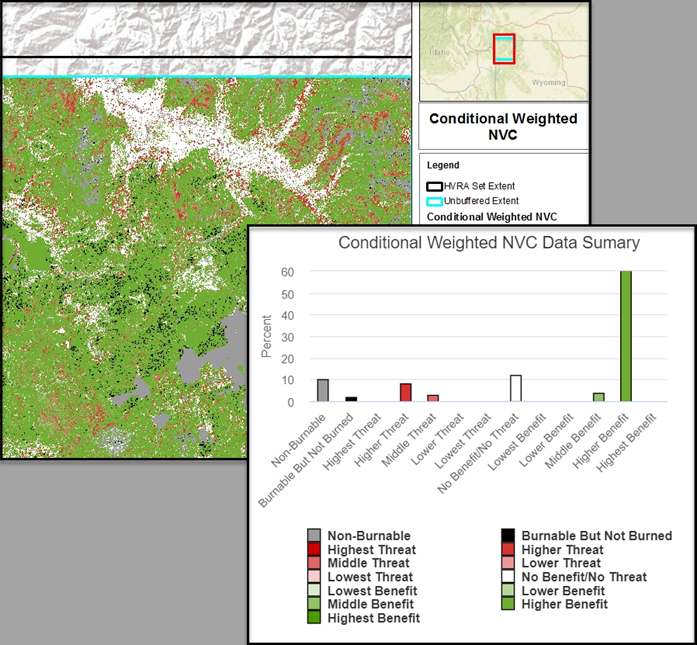
Conditional Weighted NVC provides an overview of the relative magnitude and distribution of risk without taking burn probability into account. It is most useful in planning scenarios where the presence of a fire is assumed and the analysis goal is less about probability and more about anticipated threats and benefits from the fire.
Important! Conditional Weighted NVCs do not take into account burn probability. They are calculated using fire intensity level (proportion of flame length), relative importance, and HVRA response functions.
The Conditional Weighted NVC map, bar chart, and table represent risk at the individual pixel level. Each pixel's fire intensity level (proportion of flame length), Primary/Sub-HVRA relative importance, and Sub-HVRA response functions are taken into account. In cases where multiple Sub-HVRA's overlap, the net effects for that pixel are displayed. Values are binned into classes based on orders of magnitude.
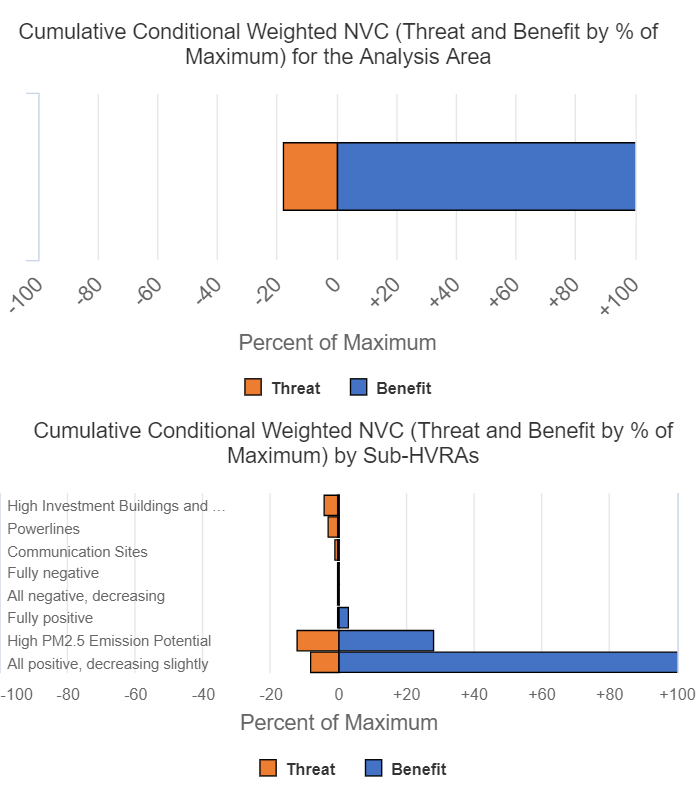
Cumulative Conditional Weighted NVC
Cumulative Conditional Weighted NVC differs from Conditional Weighted NVC in that the values represent the calculated total (sum) threat and/or benefit rather than binned classes. Both threat and benefit are displayed and in some cases one may offset the other resulting in a positive, negative, or zero Cumulative Net Value Change. The % of Max is normalized based on the highest threat or benefit value for the analysis.
These products provide a useful way to summarize the magnitude of Cumulative Conditional Weighted NVC for the analysis area or across Sub-HVRAs. These metrics are not directly comparable across analyses but do provide an approximation of the over-all quantification of risk without factoring in burn probability.
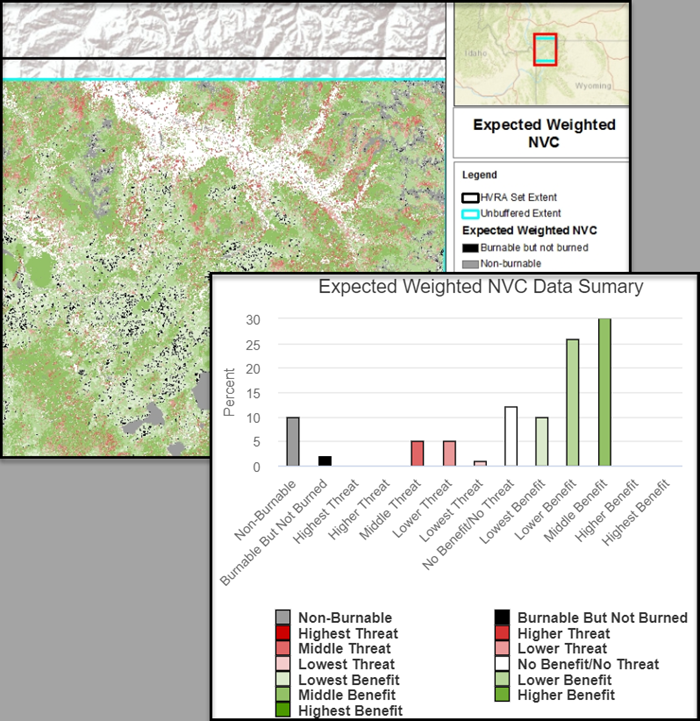
Expected Weighted NVC provides an overview of the relative magnitude and distribution of risk. It is used for planning scenarios where the likelihood of fire needs to be considered, as well as the threats and benefits.
Important! Expected Weighted NVCs take into account burn probably for each pixel as well as fire intensity level (proportion of flame length), relative importance, HVRA response functions.
Expected Weighted NVC combines Conditional Weighted NVC and Burn Probability. The map, bar chart, and table represent risk at the individual pixel level. Each pixel's burn probability, fire intensity level (proportion of flame length), Primary/Sub-HVRA relative importance, and Sub-HVRA response functions are taken into account. In cases where multiple Sub-HVRA's overlap, the net effects for that pixel are displayed. Values are binned into classes based on orders of magnitude.
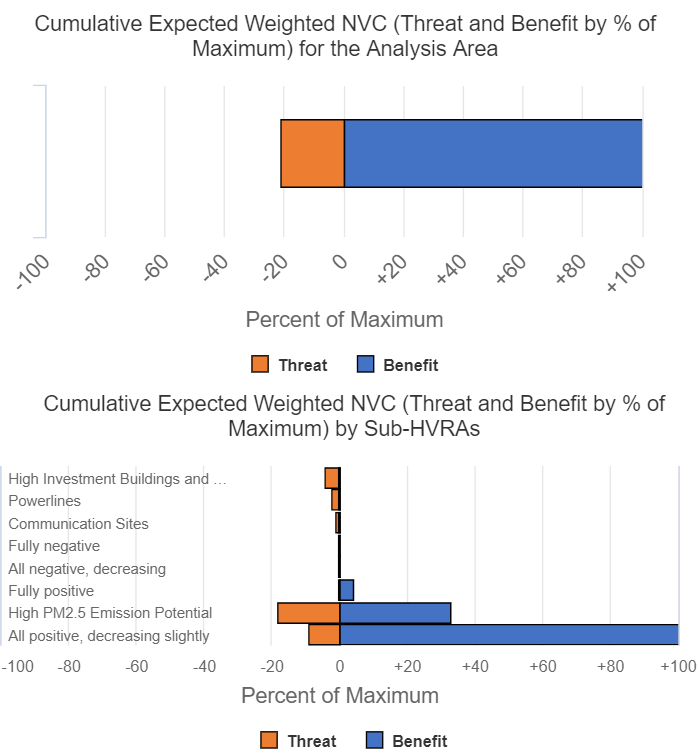
Cumulative Expected Weighted NVC
Cumulative Expected Weighted NVC differs from Expected Weighted NVC in that the values represent the calculated total (sum) threat and/or benefit rather than binned classes. Both threat and benefit are displayed and in some cases one may offset the other resulting in a positive, negative, or zero Cumulative Expected Net Value Change. The % of Max is normalized based on the highest threat or benefit value for the analysis.
These products provide a useful way to summarize magnitude of Cumulative Expected Weighted NVC for the Analysis Area or across Sub-HVRAs. These metrics are not directly comparable across analyses but do provide an approximation of the over-all quantification of risk for a particular analysis.
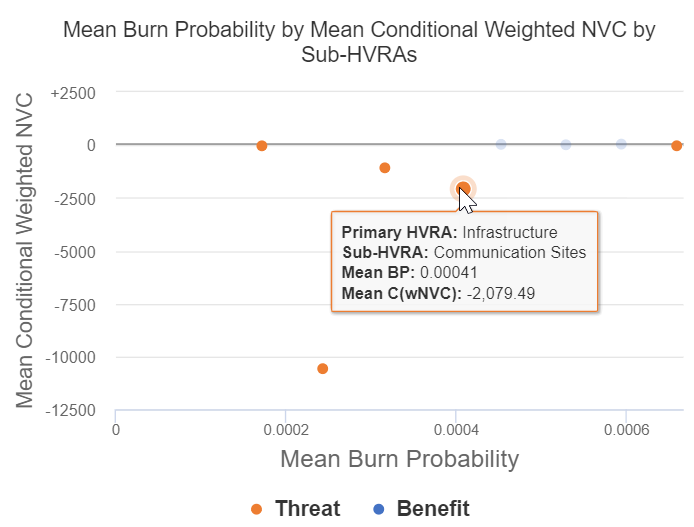
Mean Burn Probability x Mean Conditional Weighted NVC - Sub-HVRA
The graph provides a useful reference for considering how various fire management strategies may target different values (Sub-HVRAs). The X-axis displays mean Burn Probability and the Y-axis displays mean Conditional Weighted NVC. Blue points represent Sub-HVRA's with positive mean Conditional Weighted NVC and orange with negative.
Wildfire risk management activities (fire prevention, preparedness, suppression, hazard reduction and susceptibility reduction) may be preferred anywhere Conditional Weighted NVC is negative with further priority given to values with highest Burn Probability. Where Conditional Weighted NVC is positive, a wider variety of wildland fire management practices (prescribed fire and management of unplanned ignitions) are potentially available (Scott and others 2014).
Response Functions (RFs) represent the susceptibility, or response, of a Highly Valued Resource or Asset (HVRA) to wildfire. Response functions are expert-defined and translate fire effects into value change (-100 to +100), based upon fire intensity.
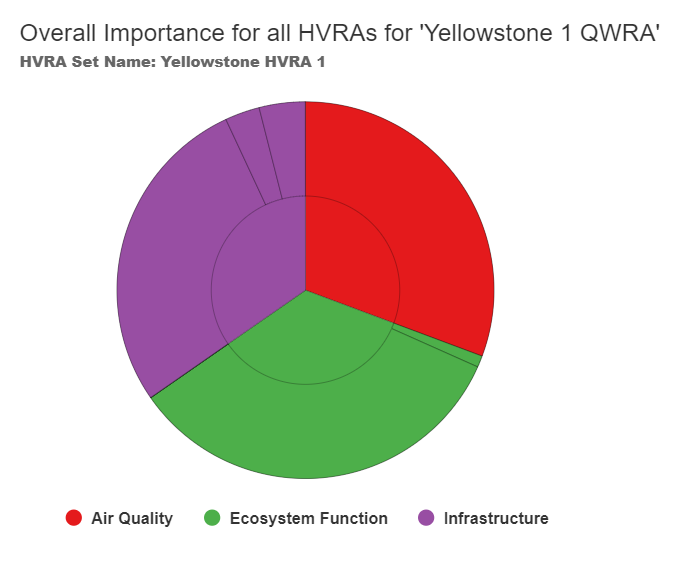
Relative Importance (RI) is used to account for the fact that some HVRAs have reason to be prioritized over others, whether due to policy, land management objectives, or other factors. Overall Importance, shown in a pie chart, is a calculated percentage for Primary and Sub-HVRAs determined by adjusting user RI inputs and weighting them based on relative extent (acreage) of Sub-HVRA.
Important! When an Area of Interest (AOI) is applied for a summary report, only the Relative Extent acreage in the table reflects the AOI. Relative Importance per Pixel and Overall Importance are derived at the landscape level.