Viewing Exposure Analysis Outputs
Opening in Map Studio
Exposure Analysis (EA) outputs are available as geospatial layers in Map Studio and within summary reports.
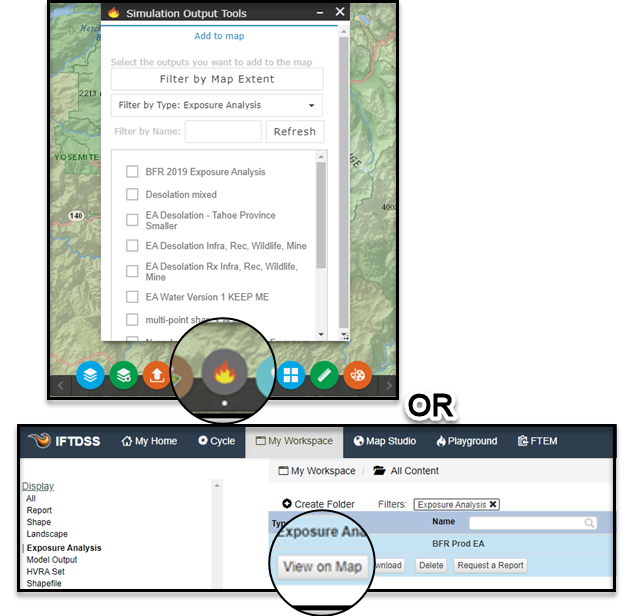
The Exposure Analysis outputs can either be added to an existing Map Studio session using the Simulation Output Tools ![]() widget or opened in Map Studio from My Workspace by selecting the Exposure Analysis file and clicking the View on Map button.
widget or opened in Map Studio from My Workspace by selecting the Exposure Analysis file and clicking the View on Map button.
Layer Order and a First Look with Layer List
Exposure Analysis outputs in Map Studio are displayed in the Layer List ![]() widget in a three tiered legend as follows:
widget in a three tiered legend as follows:
- Exposure Analysis
- Geographic Extent
- HVRA Set Extent: Turned on by default, visible as a black bounding box.
- Landscape Extent (non-buffered): Turned on by default, visible as a turquoise bounding box.
- Primary HVRA Categories(s): Turned on by default.
- Sub-HVRA(s): Turned off by default so you can choose the ones to display.
- Landscape Burn Probability model outputs
- Burn Probability: Turned on by default.
- Conditional Flame Length Turned off by default.
- Integrated Hazard Turned off by default.
- Geographic Extent
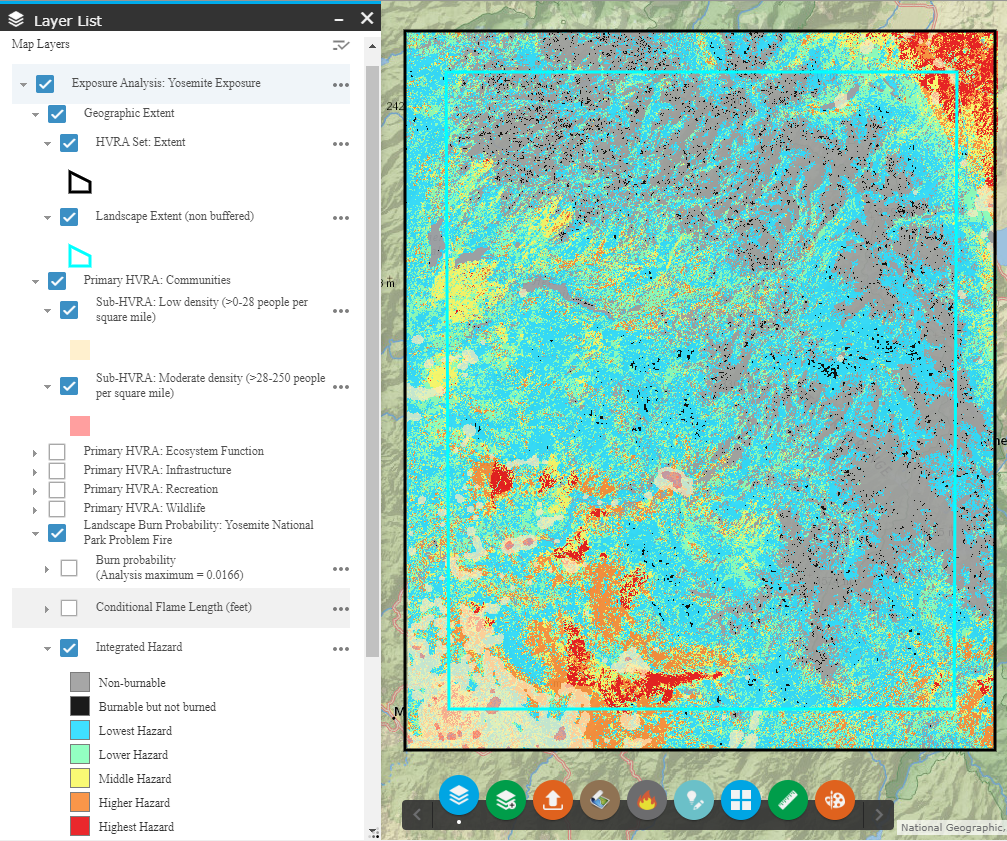
These tiers allow you to quickly turn on and off different layers in the map. In the example below, you can see that there are multiple Primary HVRA Categories and Sub-HVRAs, but only some have been turned on, while others have been turned off. Turned on in the example below are:
- Exposure Analysis
- Geographic Extent
- HVRA Set Extent
- Landscape Extent (non-buffered)
- Primary HVRA: Communities
- Sub-HVRA: Low density (>0-28 people per square mile)
- Sub-HVRA: Moderate density (>28-250 people per square mile)
- Landscape Burn Probability
- Integrated Hazard
- Geographic Extent
The other primary and Sub-HVRAs have been turned off and collapsed. You may find it helpful to click Control all layers  in the top right of the Layer List widget to turn on, turn off, expand, or collapse all layers.
Important! Sub-HVRA points and lines in Exposure Analysis may be very difficult to see unless you zoom in, because they are rasterized versions of the original HVRA Set data. They are the same resolution as the Landscape Burn Probability model outputs and therefore might look different at first glance. See Exposure Analysis Technical Documentation for more detail.
More Detail with Identify
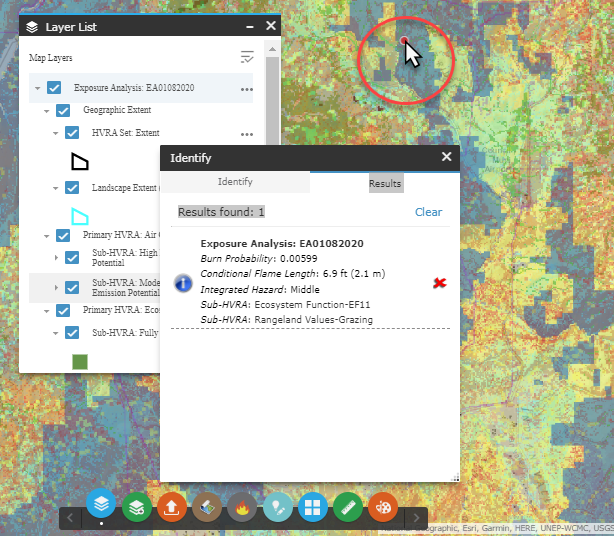
The Identify ![]() widget displays more detailed information for the classified layers shown in the Layer List
widget displays more detailed information for the classified layers shown in the Layer List ![]() . This includes the values for burn probability, conditional flame length, integrated hazard, and Sub-HVRAs that intersect the point.
. This includes the values for burn probability, conditional flame length, integrated hazard, and Sub-HVRAs that intersect the point.
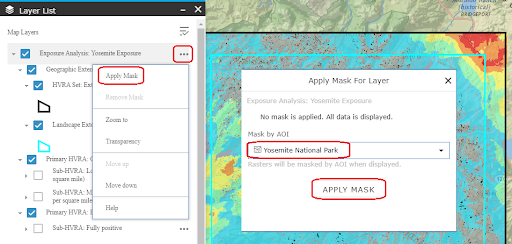
Viewing Outputs Using Masks
With an Exposure Analysis, you can apply a mask, much like you can with model outputs and landscapes.
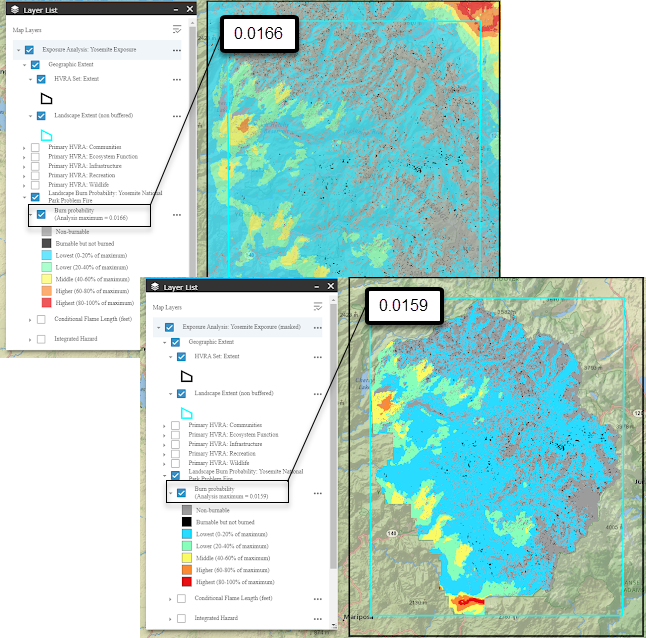
As with masking Landscape Burn Probability model outputs, masking an EA dynamically updates your Burn Probability and Integrated Hazard classes based on the Analysis maximum burn probability value. In the unmasked EA, the analysis maximum burn probability is 0.0166, whereas in Yosemite National Park, the Analysis maximum burn probability is 0.0159.
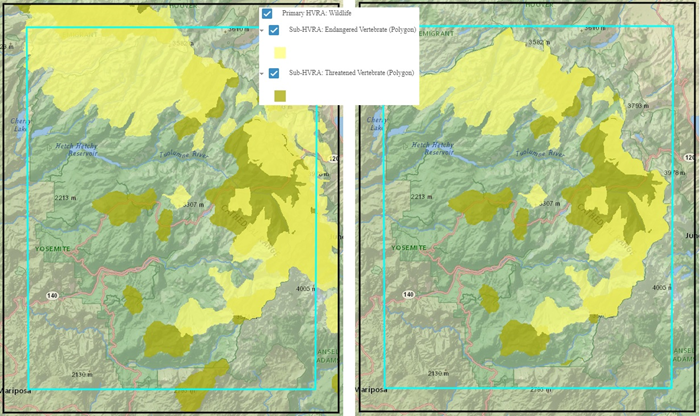
Masking is also applied to the Sub-HVRAs. The example below shows the Endangered and Threatened Vertebrates Sub-HVRA within the Primary HVRA Category: Wildlife. Left is the original extent of the Sub-HVRA, right is the smaller version clipped to the Yosemite National Park boundary mask.
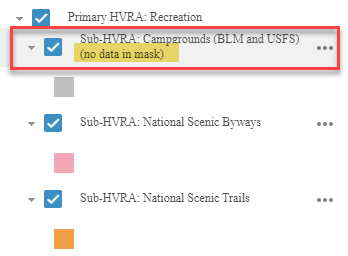
When you apply a mask, some Primary HVRA Categories and/or Sub-HVRAs may no longer be visible because they completely fall outside of the extent of the mask. Although these have been masked out of the current map view, they remain in the Layers List, and are followed by the phrase "no data in mask" in parenthesis, as seen in the image below.