About Exposure Analysis (EA)
Introduction
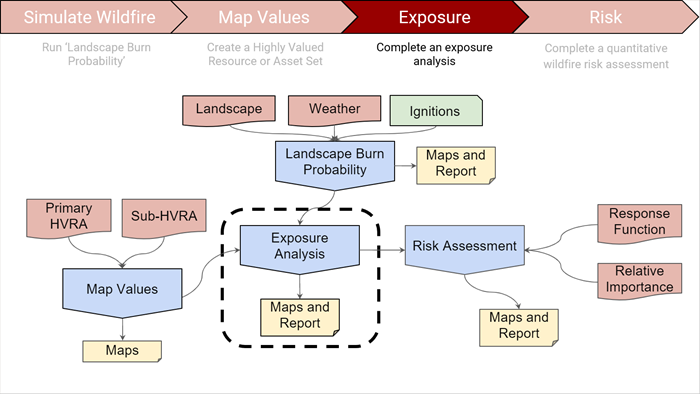
Exposure Analysis quantifies the Landscape Burn Probability (LBP) model outputs where they overlap with Highly Valued Resources or Assets (HVRAs). The resulting outputs aid in HVRA evaluation by enabling the comparison of burn probability, conditional flame length, and hazard across your analysis area. The Map Studio output shows a rasterized version of your HVRAs with the three LBP outputs. A summary report for an Exposure Analysis (EA) output calculates the following for each HVRA:
- Mean burn probability
- Mean conditional flame length
- Mean integrated hazard
- Mean of product of burn probability and conditional flame length (BP*CFL )
- Relative Extent
- Expected Area Burned
Definition
In IFTDSS, Exposure Analysis is an assessment of wildfire hazard—likelihood and intensity—where HRVAs are located (Scott et al 2013).
Why Conduct an Exposure Analysis
Exposure Analysis is a required step in the Quantitative Wildfire Risk Assessment (QWRA) process. However, you may find that the Exposure Analysis is sufficient to meet your planning needs of assessing probable fire exposure to HVRAs without having to go through the detailed calculations of a QWRA.
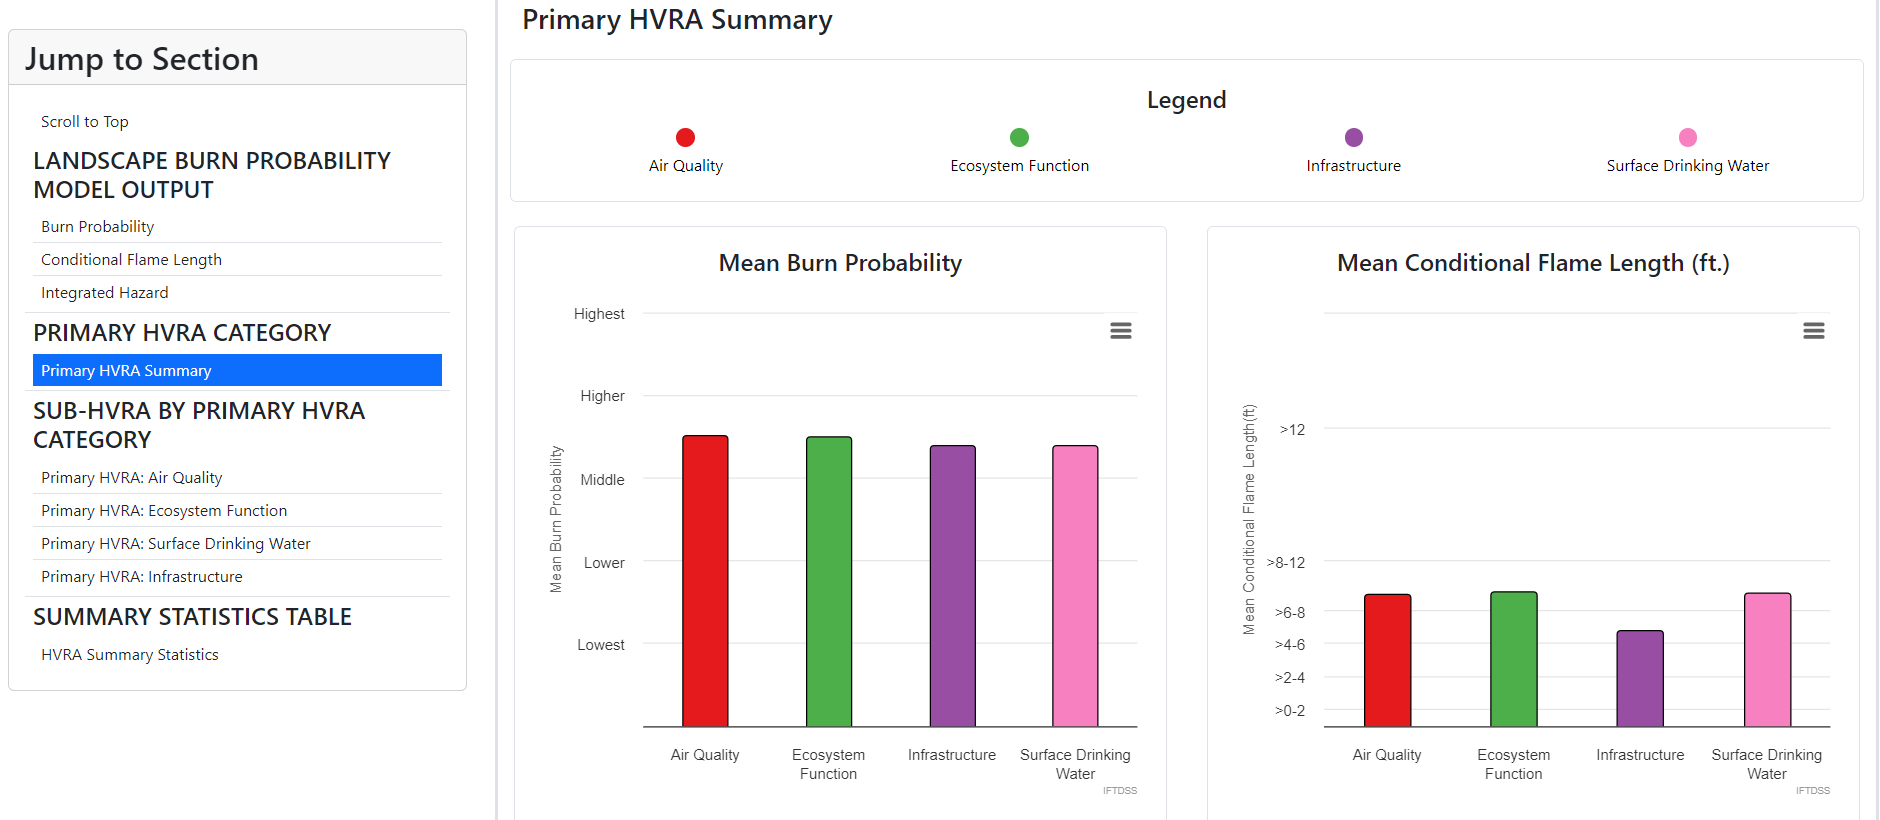
Producing a summary report for an EA output provides an easy way to compare the mean exposure of all defined values side by side in graphical form (see the Report outputs topic for more detail). The results displayed in the report can be useful in determining treatment location priorities relative to values and their exposure to fire. The results may indicate some clear trends, or may prompt you to analyze further in a full QWRA to explore the exposure in terms of net benefit or net threat to values. Additionally, the exposure analyses can provide a method for comparing proposed treatment impacts on value exposure.
Running Exposure Analysis
Exposure Analysis requires Landscape Burn Probability model outputs and an HVRA Set of the same extent. When run, you will be able to follow on screen prompts to clip larger HVRA Sets to smaller LBP model output extents in order to run the analysis; however, you will not be able to use HVRA Sets that only partially cover the LBP model output area.
When run, Exposure Analysis will create a rasterized version of your selected HVRA Set. Get the most out of an Exposure Analysis by running a summary report for your outputs. For a step by step tutorial on running and viewing Exposure Analysis, see the Exposure Analysis Tutorial topic.
