Quantitative Wildfire Risk Assessment (QWRA) Relative Importance (RI)
Relative Importance (RI) is used to account for the fact that some HVRAs have reason to be prioritized over others, whether due to policy, land management objectives, or other factors. Without articulating relative importance, all HVRAs would be weighted equally and the characterization of risk in areas with overlapping HVRAs might not appropriately reflect management objectives or the tradeoffs associated with competing or conflicting objectives.
To allow for analysis across multiple HVRAs, it is necessary to weight risk calculations by the RI of both Primary HVRA Categories and Sub-HVRAs. Assigning RI is not necessary for calculating risk when only one Sub-HVRA is present; it is only necessary when multiple Sub-HVRAs exist within a Risk Assessment.
Determining Relative Importance
Relative Importance is usually assigned in a workshop with line officers, fire planners, and resource specialists present. During this time, HVRAs are ranked in importance based on qualitative justification and how they relate to existing guidance, policy, or doctrine. Typically, the Primary HVRA Categories are all assigned RI before moving to the Sub-HVRAs. The following process is suggested for assigning RI scores (adapted from GTR-315):
- Provide qualitative justification for rankings, and their relation to existing guidance/doctrine/policy.
- Assign the most important Primary HVRA Category a score of 100. Assign all other Primary HVRA Categories scores on scale of 1-100 based on the relative importance compared to the most important category. More than one can be assigned a value of 100.
- Within each Primary HVRA Category, assign the most important Sub-HVRA a score of 100. Assign all other Sub-HVRAs, within each Primary HVRA Category, a score on scale of 1-100 based on the relative importance compared to the most important Sub-HVRA. More than one can be assigned a value of 100.
- Review, critique, and refine scores (iterative for both Primary HVRA Categories and Sub-HVRAs).
Understanding the Overall Importance
Within the IFTDSS application, we included an interactive pie chart that displays the percentage of Overall Importance where RI is entered. The chart allows you to understand how entered RI values contribute to an overall importance, which adds transparency to the process of determining importance.
The inner circle of the pie chart expresses the overall importance of the Primary HVRA Categories. The outer circle expresses the overall importance of each Sub-HVRA. The pie chart is interactive and automatically recalculates as RI values are entered or changed. At least one Primary HVRA Category and one of its Sub-HVRAs must be assigned a RI for the chart to begin to populate.
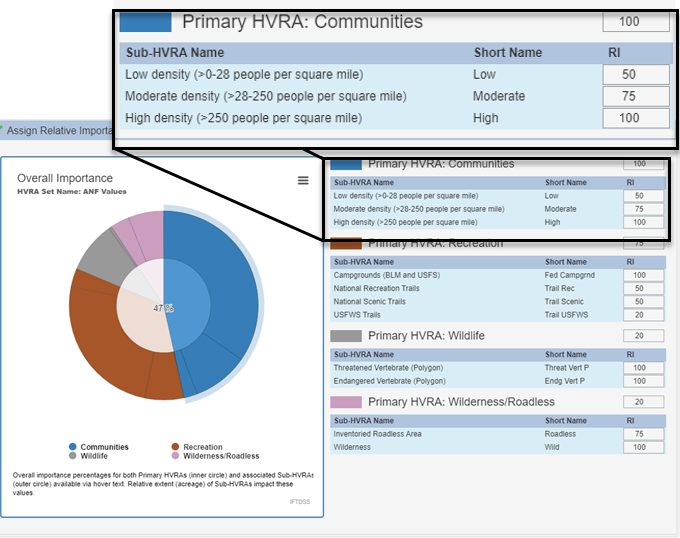
Primary HVRA Overall Importance
The overall importance of the Primary HVRA Categories is calculated first. For each Primary HVRA Category, it is expressed as the ratio of that RI to the sum of all Primary RI values. For example, in the image above, the percentage of overall importance for Communities (with an RI of 100), is calculated as follows:
100 / (100+75+20+20) = .465 = 47%
Sub-HVRA Overall Importance
The overall importance of the Sub-HVRAs is not as straightforward. The calculation takes into account the RI assigned and the Relative Extent (RE, number of pixels) of the Sub-HVRA as well as the overall importance of the Primary HVRA Category it is within. Because RE is included, those with the highest RI do not always have the highest overall importance. For example, continuing with the Communities Primary HVRA Category, the High Density Sub-HVRA was the most important Sub-HVRA and was assigned a RI of 100, yet it only accounts for 5% of the Primary HVRA Category importance and 2% of the overall importance. This is because relative to the other Sub-HVRAs within Communities the High Density class only accounts for 3% of the extent.
| Sub-HVRA Name | RI | RE (pixels) | Primary Importance | Overall Importance |
|---|---|---|---|---|
| Low density (>0-28 people per square mile) | 50 | 135,855 | 75% | 35% |
| Moderate density (>28-250 people per square mile) | 75 | 25,039 | 20% | 10% |
| High density (>250 people per square mile) | 100 | 4,405 | 5% | 2% |
Influence of RI on QWRA Results
The RI values assigned to the Primary HVRA Categories and Sub-HVRAs are used when calculating Conditional and Expected Weighted Net Value Change (NVC). The RI values, along with the Relative Extent (RE) are used to calculate what is known as the Relative Importance Per Pixel (RIPP), this is used in the NVC calculations. For more information about the NVC calculations see the Technical Documentation topic.
Relative Importance Per Pixel is a weighting factor which takes into account the RE of each Sub-HVRA to avoid overemphasizing those that cover a large area. This method results in the RI being spread out over the entire extent of the Sub-HVRA. Therefore a Sub-HVRA with few pixels can have a high RIPP and those with a larger footprint can have a lower RIPP. We include the calculated RIPP values within the download package.