Quantitative Wildfire Risk Assessment (QWRA) Considerations
Choosing HVRAs for QWRA
When identifying which HVRAs to include in your analysis, it is important to limit the list of HVRAs to those of high value. Keeping the scope limited ensures that the interpretation of the results from your analysis remains manageable. For more information, please see HVRA Set Considerations and Map Values.
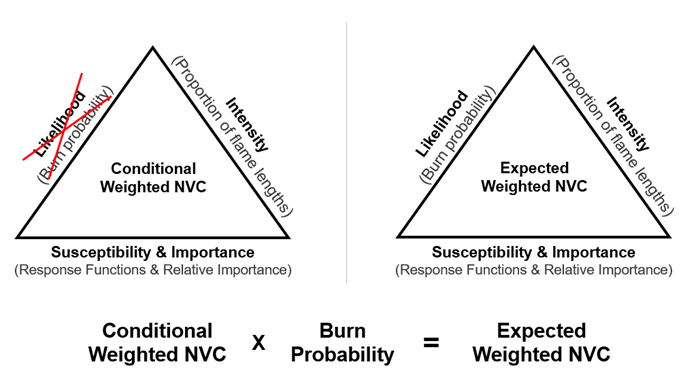
Choosing between Conditional and Expected Weighted Net Value Change
The difference between the two is the inclusion or omission of Burn Probability (Likelihood) in the calculation. Is your analysis best premised on the assumption a fire will definitely occur (Conditional) or is the likelihood of a fire an important consideration (Expected)? In other words, are you interested in “when” (Conditional) a fire occurs, or “if” (Expected) a fire occurs.
Questions to Ask When Choosing Between Conditional and Expected May Include:
- Are proposed treatment area boundaries already defined?
- If yes, then Conditional Weighted NVC may be more useful as you evaluate the impacts knowing it is a matter of when and not if a fire occurs.
- If no, then Expected Weighted NVC may be of value as you can evaluate how likely an unplanned fire might be and decide if placing a fuels treatment in that location is of value.
- Is the baseline for comparison analysis more focused on the likelihood of fire, the impacts of fire, or both likelihood and impacts?
- Are you focused on the scenario where you are assuming a fire is going to occur? If so, you can use Conditional Weighted NVC to focus on the trade-offs of fire impacting various HVRA’s. How much of a threat is a fire to which HVRA’s? Or will fire be of benefit to your HVRA’s and to what degree?
- If the likelihood of fire occurring is of interest to your assessment then it’s a question of Expected Weighted NVC – how likely is it for that area to have a fire? That information coupled with the threat/benefit potential can assist in deciding if a fuel treatment would mitigate the impacts to HVRAs if a fire occurred.
- For suppression scenarios: Is the fire already on the ground? Or is the analysis use for pre-planning?
- When fire is currently burning, the real question is what HVRA’s will the fire impact and to what degree? In this case Conditional Weighted NVC is most useful to help you understand if the impacts be detrimental or beneficial.
- When fire is not currently burning, but you want to know the fire potential, then Expected Weighted NVC leads you to understand the likelihood as well as the expected impacts on HVRAs.
| Analysis Consideration | Conditional Weighted NVC | Expected Weighted NVC |
|---|---|---|
| Treatment Locations | Fixed or Highly Known; impacts more of interest than fire likelihood. | TBD based on both fire likelihood and impacts; where should I treat? |
| Future Comparisons | Threat/benefit comparison is the primary analysis objective. | Likelihood is considered as well as threat/benefit in alternatives analysis. |
| Suppression Planning | Fire exists; location and conditions are known. Pre-planning based on scenarios of known fire location. | Pre-Planning based on fire likelihood, no specific fire or conditions. |
Comparing QWRA Outputs from Differing Locations
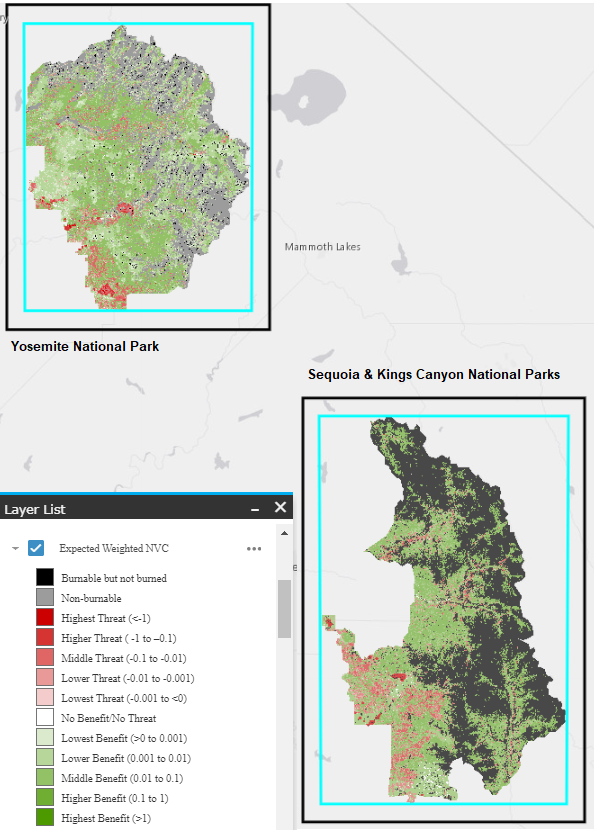
The legends for Conditional and Expected Weighted NVC use static bins based on orders of magnitude (where the given bin is 10 time that of the preceding bin). Because E(wNVC) includes burn probability, it is always much smaller than C(wNVC) therefore, the bins are scaled differently.
The use of these static bins in the legend allows you to visually compare C(wNVC) or E(wNVC) across Risk Assessments from different locations. These comparisons are coarse scale and must consider the caveats described below.
Caveats for Comparing QWRAs from Different Locations
For example, you can run separate Risk Assessments for both Yosemite and Sequoia & Kings Canyon National Parks and then assess the proportions and spatial locations of the various levels of both threats and benefits. However, you must consider the inputs that were used to generate the individual risk assessment in order to determine if this is an appropriate comparison .
Below is a comparison consideration checklist:
- Was Landscape Burn Probability run under similar conditions? Were the inputs either representative of a "problem fire" for each landscape or were the same percentiles conditions used for each location? For example, was 97th percentile used for all simulations?
- Are the HVRA Sets similar? They may not be identical given not all values exist in all locations. But do they include the same Primary HVRAs and associated Sub-HVRAs (where applicable)? (Note: Map Values does not have acreage limit in order to facilitate units or regions developing consistent HVRA Sets – see AOI for Geographic extent Considerations).
- For the Sub-HVRAs that are present in all areas that are being compared, do they all use the same Response Functions?
- Are the Relative Importance values consistent across analyses wherever they occur?
If you can answer yes to the above list, then your comparison will be more robust and you can deduce that differences in Weighted Net Value Change are mostly related to the differences in fuels and fire behavior. If too many factors are not similar across the areas being compared, you can’t easily deduce what is impacting those changes.
Comparing QWRA outputs for Assessing Impacts of Treatment Alternatives
We are currently working on a Comparison Dashboard in IFTDSS that will facilitate direction comparison of QWRAs within IFTDSS and generate reports summarizing the differences.
Until the comparison dashboard is finished, you need to run separate risk assessments for the same landscape extent to understand the impact of disturbance or treatments on Weighted Net Value Change. To do this, everything should be held constant except the landscape. Varying the landscapes represent the suite of disturbances or treatments you want to compare.
Listed below are the best practices to be able to complete an alternatives comparison to determine the impacts of treatments on your own.
To ensure the best possible comparison is completed, follow these steps:
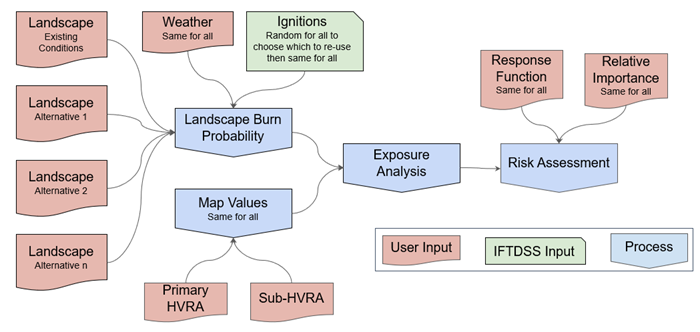
- Create an Existing Condition (EC) Landscape.
- Conduct a LBP model run on your EC Landscape.
- Create landscapes for all treatment alternatives (See the landscape editing topics if details are needed).
-
Edited (Alternative) Landscapes with the Use Random Ignitions option selected, keeping the other inputs (that you established in step 2) the same.
- Repeat running Landscape Burn Probability with ‘Use Ignitions From a Completed Run’ where the Completed Run is then one that required the most fires (See the topic on LBP Considerations and Using Ignitions from a Completed Run for LBP Refinement or Comparison for information on choosing ignition set in Comparison scenarios)
- Create your HVRA Set in Map values. You will use this same HVRA Set throughout the comparison.
- Run an Exposure Analysis for each alternative landscape’s Landscape Burn Probability model output using the same HVRA Set for all iterations.
- Run a Risk Assessment using the Exposure Analysis for each alternative while keeping Response Functions and Relative Importance inputs constant for all iterations.
This process is graphically represented in the flowchart below.
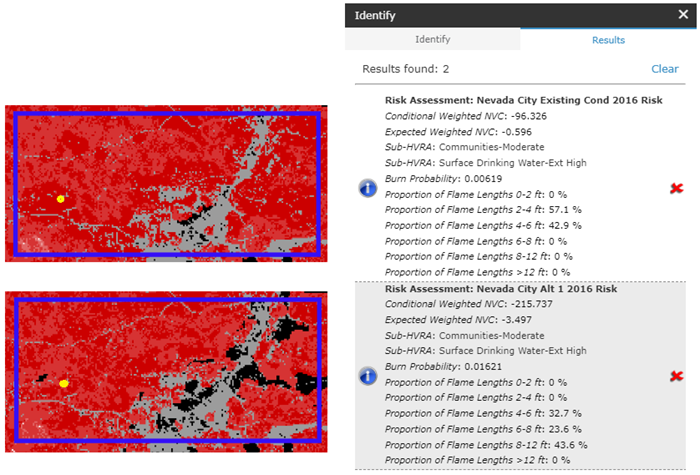
Once these analyses are all compete, users can use the Identify ![]() widget and Swipe
widget and Swipe ![]() functionality within IFTDSS to compare treatments. In the example below, by loading both QWRA outputs in the Map Studio and using the Identify
functionality within IFTDSS to compare treatments. In the example below, by loading both QWRA outputs in the Map Studio and using the Identify ![]() widget, you can see the different outputs between Existing Condition and Alternative 1. In this pixel, Alternative 1 represents an increase in both Conditional and Expected Weighted NVC.
widget, you can see the different outputs between Existing Condition and Alternative 1. In this pixel, Alternative 1 represents an increase in both Conditional and Expected Weighted NVC.