Developing Treatment Alternatives - Colville National Forest Example
Section 4– Reviewing the Auto97th Report
Now that you’ve thoroughly reviewed the map to assess the landscape, modeled fire behavior, and areas for treatment, you’ll want to look at the corresponding landscape and fire behavior summary reports.
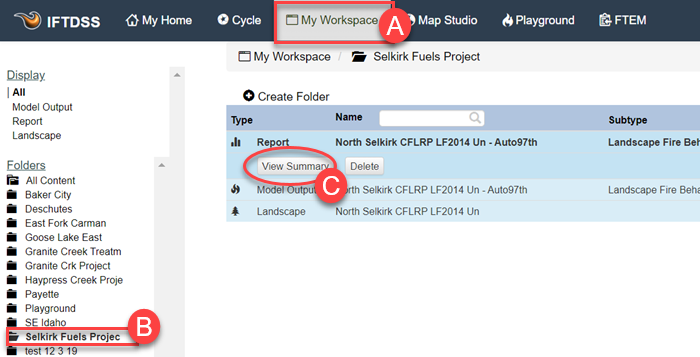
- Navigate away from Map Studio and click on My Workspace at the top of the screen.
- Because the Landscape was assigned to the Selkirk Fuels Project folder when you first created it, the model output summary report will also be stored there by default. Select the “Selkirk Fuels Project” folder from the panel on the left of the screen. As you navigate, you’ll notice the information in the right-hand panel changes too, updating as you move through different screens.
-
Right click on the “North Selkirk CFLRP LF23 UnEd—Auto97th” report file and click the View Summary button. The report will open in a new browser tab.
-
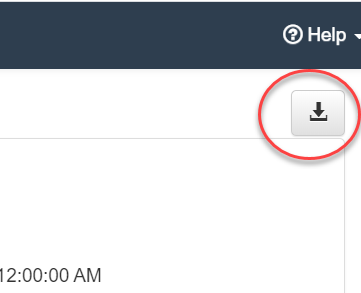
In the top right of the report, click the Download button to save a copy to your local computer, you’ll refer to this PDF again later in this tutorial.
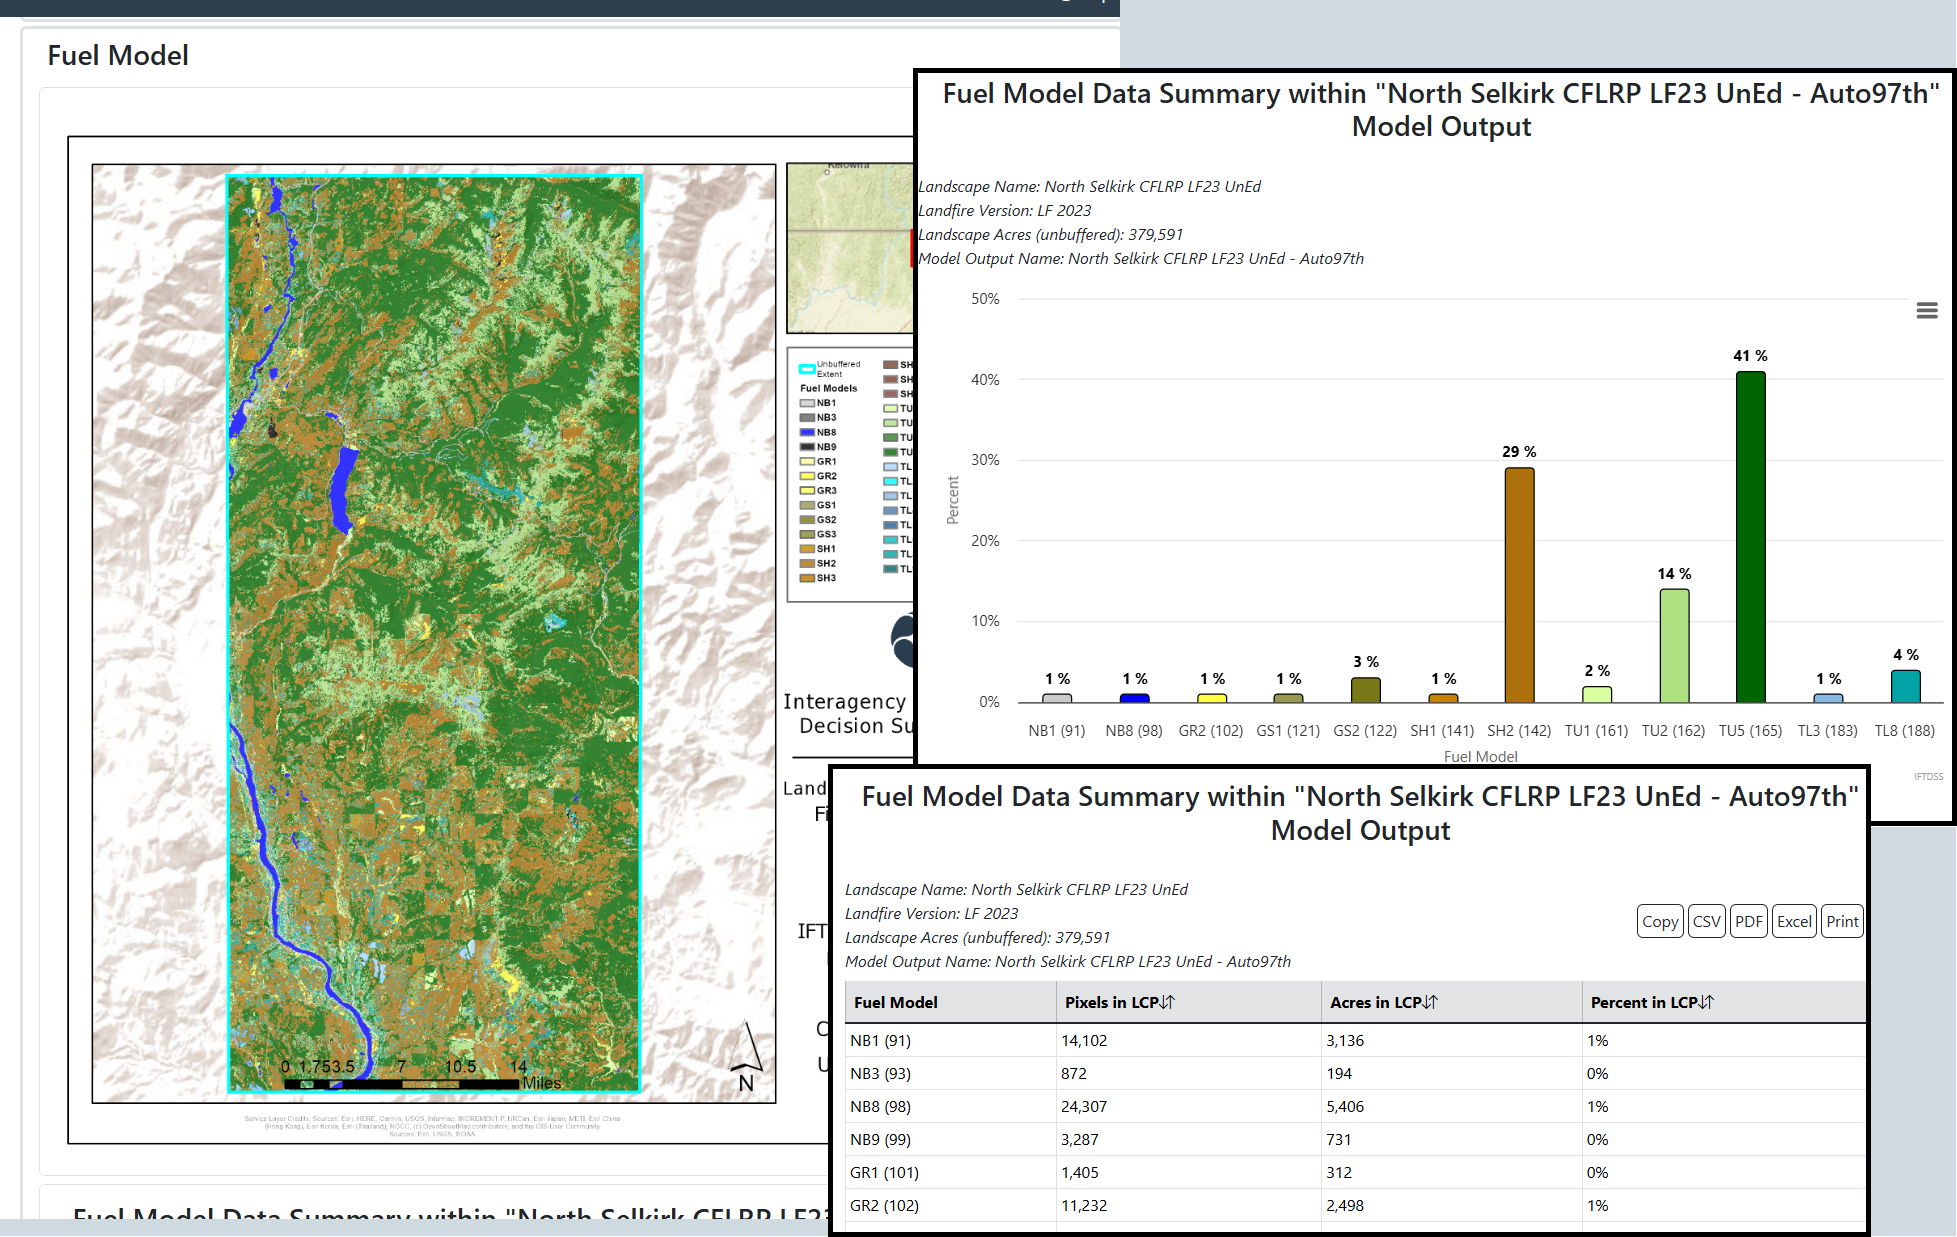
All of the Landscape characteristics and Fire Behavior outputs you viewed in Map Studio are quantitatively displayed in several different formats in this report. You’ll find a lot of value in these reports because they break each component (Canopy Cover, Canopy Base Height, Rate of Spread, etc.) down in a way that makes it even easier, after viewing the spatial data, to assess the landscape and 97th percentile modeled fire behavior. For example, in viewing the Fuel Model map (upper left corner), you can see that there is a lot of Fuel Model TU5 on the landscape, but it’s not until you take a look at the graphs that you can really assess that, in fact 41% of this landscape is attributed to the TU5 fuel model.
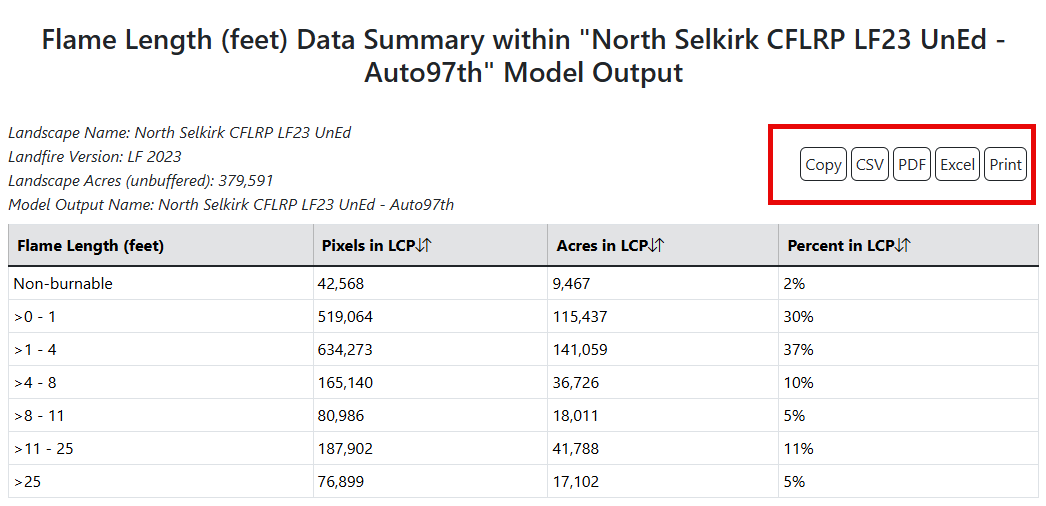
Take a good look at the report in it’s entirety, including the Flame length outputs:
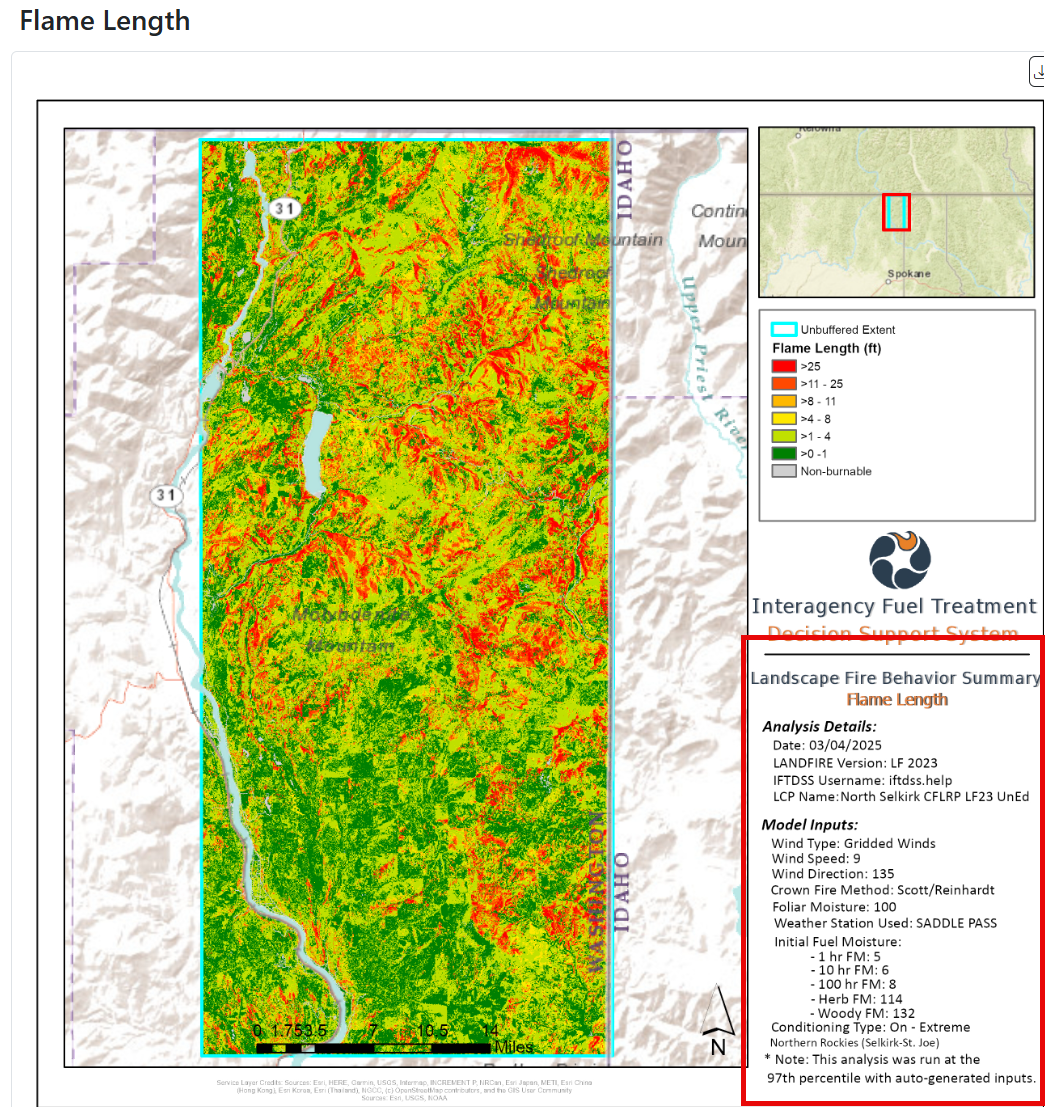
Notice the Auto97th Fire Behavior section of the report has recorded the 97th percentile weather and fuel moisture inputs used to run the fire behavior model. You’ll want to use these values when you re-run the fire behavior model a little later in this tutorial. If you have not already saved a PDF copy of the report, scroll up to the top of the report, look to the top right, and click the Download button to save this report as a PDF on your local machine.
Each chart also has a download button to the right so it may be downloaded individually for use in your own documents. Tables have download buttons under the table descriptions.
Next, it’s time to develop some treatment alternatives.