Viewing Quantitative Wildfire Risk Assessment (QWRA) Outputs
Select Quantitative Wildfire Risk Assessment (QWRA) outputs are available as geospatial layers in Map Studio and within summary reports.
The model outputs can be added to the map using the Simulation Output Tools widget or from Workspace by clicking View on Map. In Map Studio you can view:
- Conditional Weighted NVC, C(wNVC)
- Expected Weighted NVC, E(wNVC)
- Sub-HVRAs
- Burn Probability
- Proportion of Flame Lengths
A First Look with Layer List
In this example the Net Value Change (NVC) output is visible, with Conditional Weighted NVC selected in Layer List. The landscape extent (non-buffered) is represented by the area within the turquoise box. The area outside the turquoise box is the buffer area.
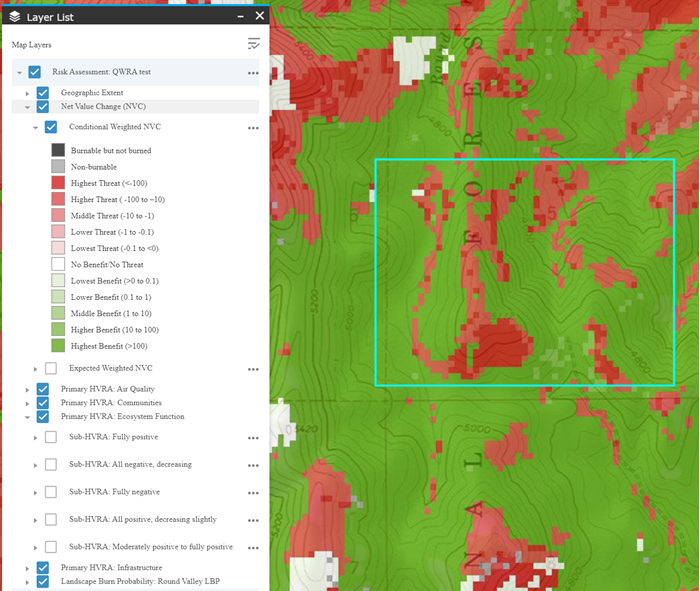
NVC values are displayed in Map Studio binned into the classes below. Benefits (positive NVC values) are represented with varying levels of green symbology while threats (negative NVC values) are represented with varying levels of red symbology. Black, gray, and white coloration represents Burnable burn not burned, Non-burnable, and No Benefit/No Threat, respectively. The classes decrease by an order of magnitude as they progress from Highest to Lowest Threat or Benefit. You’ll notice in the table below Conditional weighted NVCs range from –100 to +100 while Expected weighted NVCs range from –1 to +1. The lower range for E(wNVC) is because it’s the product of C(wNVC) and Burn Probability .
| Class | Conditional Weighted NVC | Expected Weighted NVC |
|---|---|---|
| Highest Threat | < -100 | < -1 |
| Higher Threat | -100 to -10 | -1 to -0.1 |
| Middle Threat | -10 to -1 | -0.1 to -0.01 |
| Lower Threat | -1 to -0.1 | -0.01 to -.001 |
| Lowest Threat | -0.1 to < 0 | -0.001 to < 0 |
| No Benefit / No Threat | 0 | 0 |
| Lowest Benefit | >0 to 0.1 | >0 to 0.001 |
| Lower Benefit | 0.1 to 1 | 0.001 to 0.01 |
| Middle Benefit | 1 to 10 | 0.01 to 0.1 |
| Higher Benefit | 10 to 100 | 0.1 to 1 |
| Highest Benefit | > 100 | >1 |
Burn Probability classes and Proportion of Flame Length classes are the same as those used for the Landscape Burn Probability model.
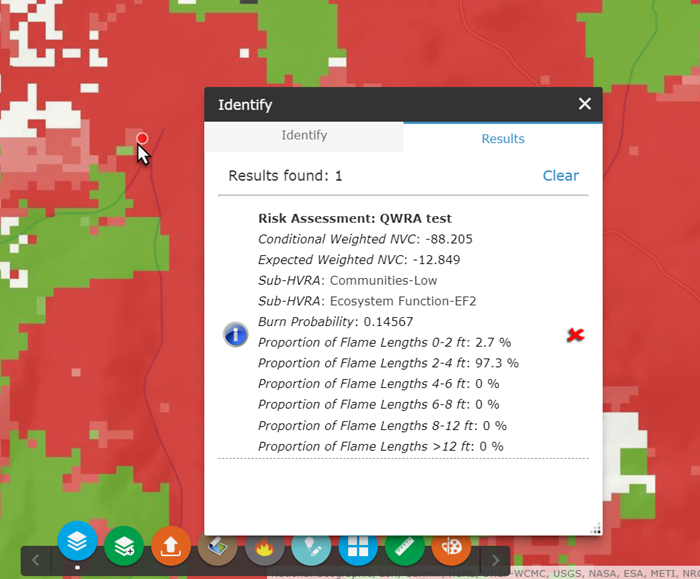
More Detail with Identify
The Identify widget displays additional individual pixel values for Conditional Weighted NVC, Expected Weighted NVC, Sub-HVRAs, Burn Probability, and Proportion of Flame lengths. Identify displays individual values for the pixel, not the classifications.
Viewing Outputs Using Masks
You may view QWRA outputs within an area of interest using Apply Mask in ![]() Layer List. The NVC and Proportion of Flame Lengths classes remain the same regardless of your mask extent. Note that the Burn Probably output is dynamic and changes depending upon mask extent based on the maximum value within the masked area. For more explanation on dynamic burn probability, see the "Viewing Outputs Using Masks” section of the Viewing LBP Outputs topic.
Layer List. The NVC and Proportion of Flame Lengths classes remain the same regardless of your mask extent. Note that the Burn Probably output is dynamic and changes depending upon mask extent based on the maximum value within the masked area. For more explanation on dynamic burn probability, see the "Viewing Outputs Using Masks” section of the Viewing LBP Outputs topic.
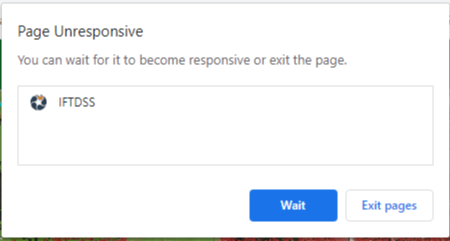
Tip: The first time you apply a mask you may get a "Page Unresponsive" pop-up in your browser (sometimes more than once). Click Wait and the mask is applied, it may take several seconds.
Viewing QWRA Outputs in Reports
Reports for QWRA outputs can be created from My Workspace by selecting a QWRA output and using the Request a Report button.