Select Landscape Burn Probability (LBP) outputs are available as geospatial layers in Map Studio and within summary reports.
The model outputs can be added to the map using the Simulation Output Tools widget ![]() , My Modeling Playground, My Workspace, or by clicking View on Map. In Map Studio you can view:
, My Modeling Playground, My Workspace, or by clicking View on Map. In Map Studio you can view:
- Burn Probability
- Conditional Flame Length
- Integrated Hazard
- Midflame Wind Speed
- 1 hr Fuel Moisture
- 10 hr Fuel Moisture
- 100 hr Fuel Moisture
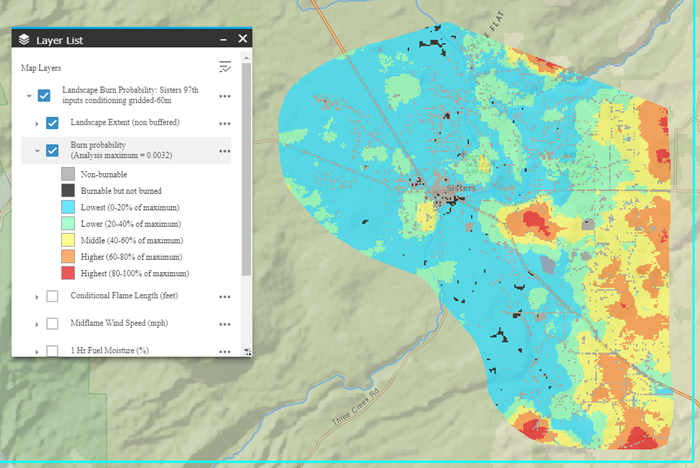
A First Look with Layer List
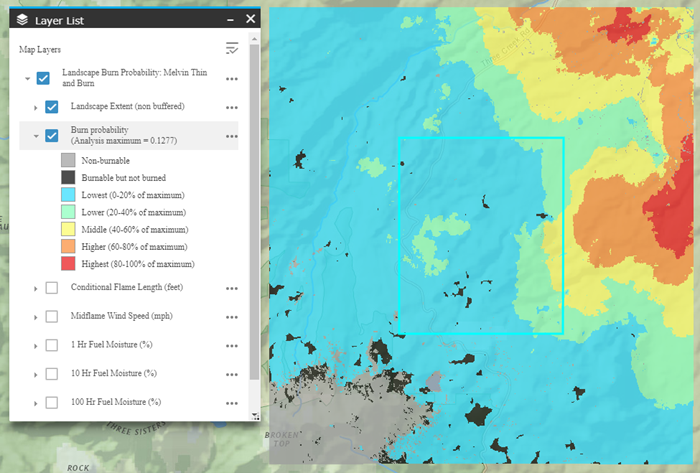
In this example Burn Probability is shown below in Map Studio with the Layer List widget ![]() displaying the legend. The landscape extent (non-buffered) is represented by the area within the turquoise box. The area outside the turquoise box is the buffer area that was required for the model to run.
displaying the legend. The landscape extent (non-buffered) is represented by the area within the turquoise box. The area outside the turquoise box is the buffer area that was required for the model to run.
More Detail with Identify
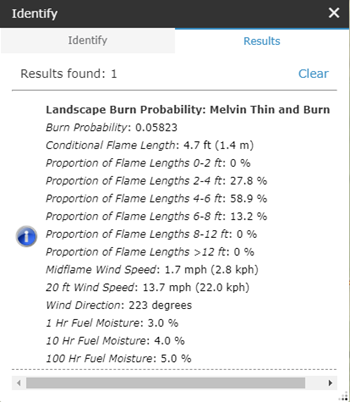
The Identify widget ![]() displays additional information not shown in the Layer List
displays additional information not shown in the Layer List ![]() . This includes, the proportion of flame lengths in the six fire intensity levels, burn probability for a specific pixel, 20 ft wind speed, and wind direction. In the example below, burn probability values are shown as a continuous number, and Proportion of Flame Length is assigned a percent for each class.
. This includes, the proportion of flame lengths in the six fire intensity levels, burn probability for a specific pixel, 20 ft wind speed, and wind direction. In the example below, burn probability values are shown as a continuous number, and Proportion of Flame Length is assigned a percent for each class.
Viewing Outputs Using Masks
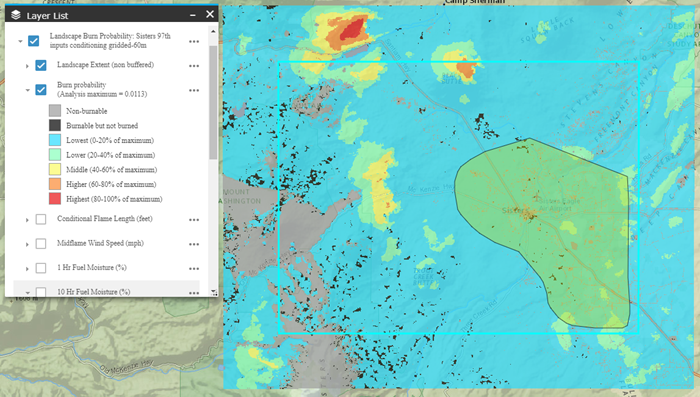
Below are examples of the three map extents possible in Map Studio. They highlight the effect of applying a mask on the burn probability legend and symbology. The first image shows the full extent of the model output, the analysis maximum burn probability is 0.0113. You can see the areas of the Highest (80-100% of maximum) burn probabilities are outside of the landscape extent (seen above and to the left of the non-buffered area).
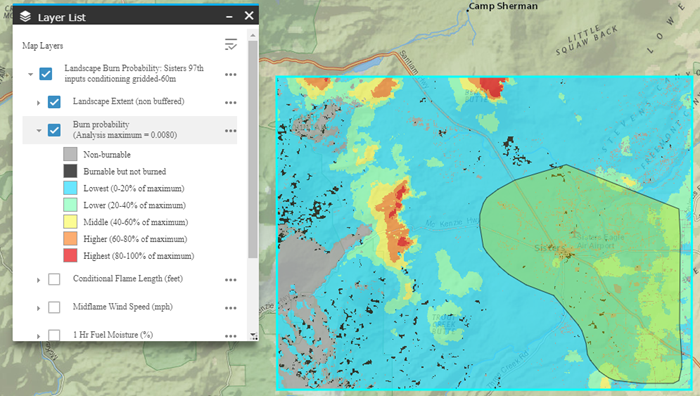
When a mask is applied to the landscape extent (non-buffered), the analysis maximum burn probability is 0.0080. This is lower than the full model extent, therefore the legend reflects a change in the maximum value. Because the bins are based off of a new maximum value there are areas of Highest (80-100% of maximum) burn probabilities within the masked area which were not present when the mask was not applied. Therefore classified values from a masked landscape should not be compared to values from an unmasked landscape, just as a landscape from one run should not be compared to a landscape from another run.
When a mask is applied to the Area Of Interest (AOI), the analysis maximum burn probability is 0.0032. This is lower than both the full model extent and the landscape extent (non-buffered) masked area. Similar to the landscape extent (non-buffered) mask, the legend reflects a change in the maximum value and the bins and symbology are changed.
Landscape Summary Burn Probability Reports
In summary reports only Burn Probability and Conditional Flame Length outputs are included. Reports can be created from My Workspace by right clicking the file or clicking More Options  , then selecting Request Report from the dropdown menu.

In the window that opens there are two options for generating a report:
- Generate report for this area of interest: allows you to select an AOI from existing shapes or shapefiles that intersect the landscape extent (non-buffered). When an AOI is used only the area within the AOI and landscape extent (non-buffered) is included in the map image and the summarized values.
- Generating a report for the entire landscape extent (non-buffered). This is done by leaving field under "Generate report for this area..." blank.
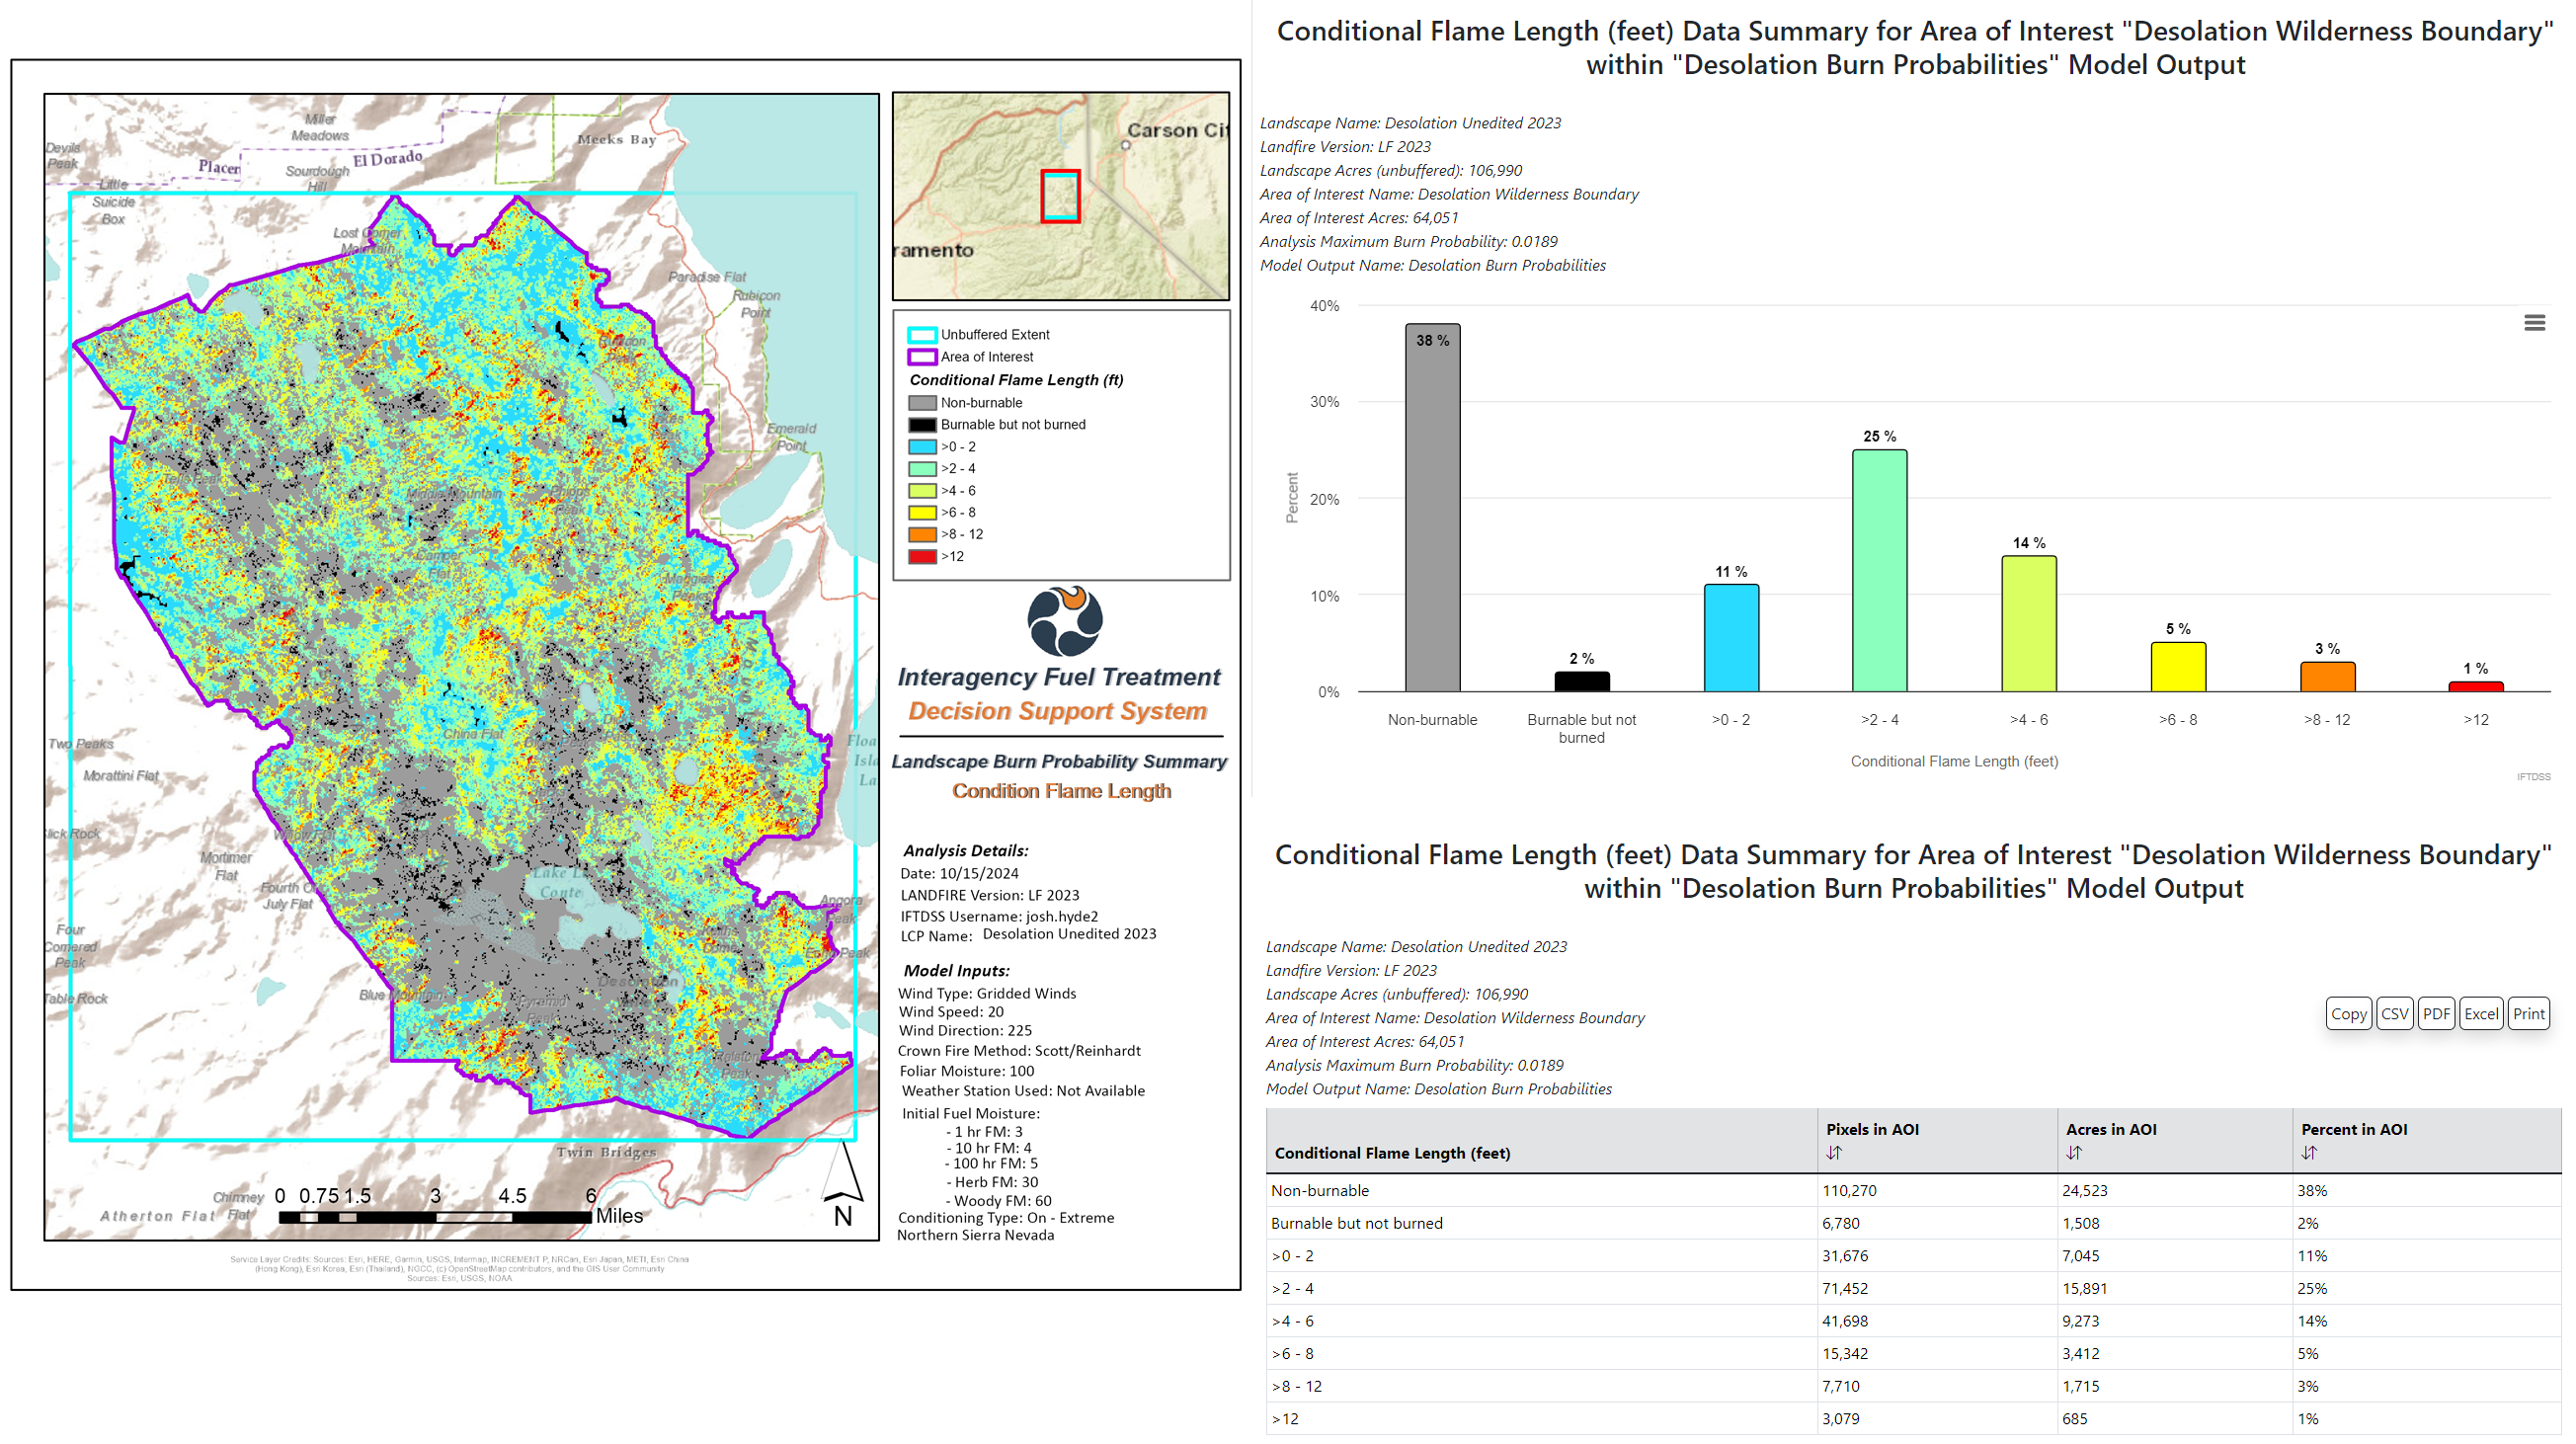
Below is an example report section for Conditional Flame Length where an AOI was selected. The summarized data in the chart and table are the same as the extent viewed on the map. This example only describes the area within the AOI.
Below is an Example of a report section for Conditional Flame Length without an AOI. The summarized data in the chart and table are the same as the extent viewed on the map. This example only describes the area within the Landscape Extent (non buffered area within the turquoise box).
