Auto97th Landscape Fire Behavior Report Documentation
The Automatic 97th Percentile Landscape Fire Behavior (Auto97th) Report is available from the Landscape Evaluation stage of the Planning Cycle, via the Landscape Summary task. The run, and subsequent summary report, uses the capabilities of FlamMap to model fire behavior based on the 97th percentile fire weather conditions for your landscape as determined by the Remote Automatic Weather Station (RAWS) closest to the center of your chosen Landscape.
Important! Auto-97th RAWS data is not available for Hawaii.
Inputs
Landscape
The landscape file contains all the information needed to complete Landscape Fire Behavior modeling in IFTDSS. The landscape consists of geospatial layers characterizing ground, surface, and canopy fuels, as well as topography. The specific components of a landscape file include:
- Fuel Model
- Canopy Cover
- Stand Height
- Canopy Base Height
- Canopy Bulk Density
- Aspect
- Slope
- Elevation
Crown Fire Method
For the Auto97th run, the crown fire calculation option is set to the Scott and Reinhardt (2001) method, but you may also choose the Finney (1998) method. Both methods are based on the same component crown fire behavior models, although there are minor differences in implementation. These subtle differences lead to significantly more predicted crown fire activity using the Scott and Reinhardt method compared to the Finney method.
Visit Crown Fire Calculations Options for more detail about these two methods.
Weather
The Auto97th run use 97th percentile fire weather conditions. Percentiles are based on a scale of 0-100 and are used to sort and rank a collection of data. For wildfire, when values at the upper end of the scale occur, we would expect to see complex fires where initial attack may often fail. The 97th percentile is often termed “the worst-case scenario.”
To determine the 97th percentile conditions, IFTDSS chooses the closest Remote Automated Weather Station (RAWS) to generate fuel moistures, wind speed and wind direction. The RAWS is selected by:
- Identifying the center of the landscape extent.
- Calculating the distance from the center to the nearest RAWS using a horizontal/vertical (elevation) algorithm.
- Ranking the stations and selecting the station which is the “closest” and has weather data requisite for running the model.
Note: The RAWS selected, and the fuel moisture and wind scenario for the automated Auto97th model, cannot be changed. It is intended to be a starting point to understand your landscape and predicted fire behavior. You may choose to run a Landscape Fire Behavior model run with user-input values in My Modeling Playground.
Once a RAWS station is selected, the Energy Release Components (ERCs) are calculated for every day. ERC is related to the available energy within the flaming front at the head of a fire. The ERC is considered a composite fuel moisture index as it reflects the contribution of all live and dead fuels to potential fire intensity. The ERC has memory, each daily calculation considers the past 7 days in calculating the new number making it relatively stable indicator of fuel conditions over time.
To determine the 97th percentile wind speed and direction, the wind observations during the normal burning period (1200-2000 hours) for the peak fire season is summarized in a table. The peak fire season is determined by the month with the highest ERC, and the month immediately before and after it. The table includes the probability of wind speed and direction for set bins.
| Wind Speed | Mid-Point Wind Speed | Wind Direction | |||||||
|---|---|---|---|---|---|---|---|---|---|
| N | NE | E | SE | S | SW | W | NW | ||
| 1.3-3 | 1.6 | 1.2 | 0.6 | 0.4 | 1.3 | 2.5 | 2.4 | 2.7 | |
| 4-7 | 6 | 5.5 | 2.5 | 2.3 | 2.6 | 4.7 | 7.6 | 11.6 | 15.5 |
| 8-12 | 10 | 2.2 | 0.7 | 0.8 | 1.6 | 3.6 | 9.9 | 11.1 | |
| 13-18 | 15 | 0.1 | 0.2 | 0.2 | 2.5 | 2.1 | |||
| 19-24 | 21 | 0.1 | 0.1 | ||||||
| 25-31 | 28 | 0.1 | |||||||
| 32-38 | 35 | ||||||||
| 39-46 | 43 | ||||||||
| 47+ | 47 | ||||||||
Wind speed and direction are selected from the table as follows:
- The row with 97th percentile speed is identified (13-18 mph in the above example),
- the mid-point wind speed (15 mph for this example) is converted to 1 minute average using Table 1 from Crosby and Chandler 2004 (20 mph for this example)
- the cell with the largest value for that row is used as the direction (west in this example),
Dead Fuel Moisture and Conditioning
The 97th percentile fuel moistures are calculated for dead (1hr, 10 hr, and 100 hr) and live (herbaceous and woody) fuels by averaging the values for all days where ERC is at the 97th percentile, this sets the initial fuel moisture.
The initial fuel moisture is then conditioned to account for topographical and weather changes over time by using an automatically generated Extreme weather scenario.
The Extreme weather stream (.wxs) data was derived from historic weather data used to model probabilistic wildfire risk components for the conterminous United States (Short and others 2016). To complete this modeling the conterminous United States was divided into 128 pyromes.
Note: Pyromes represent areas with similar fire characteristics which are determined by the fire regime (frequency, intensity, size, season, type, and extent), vegetation, and climate (Archibald and others 2013).
For each pyrome, historic RAWS data utilizing stations meeting quality assurance and currency requirements were analyzed to determine date ranges under which representative "extreme" or "near maximum worst case" conditions were encountered. The date range to use was determined by reviewing the daily ERC-G (Energy Release Component for NFDRS Fuel Model G) indices for the past 20 years and selecting a one to two week period where most of the days were at or above the 97th percentile. Below is an example of the Fuel Moisture Conditioning inputs that a user will see for a model run that was completed using the Classified Weather Stream option, it shows Pyrome Name as well as start and end date and time.
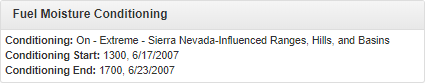
The conditioning period is unique for each pyrome; however, it always starts at 1300, which is the time when NFDRS calculates the initial fuel moistures. The initial fuel moistures used to determine the conditioning period are the same as the values used in the Automatic 97th Percentile Landscape Fire Behavior (Auto97th) Report. The duration of conditioning and the ending time was determined after running conditioning for several end dates and times. The dead fuel moisture grids were reviewed for site characteristics that match the RAWS location, typically cells with zero canopy cover and a similar elevation. Since 1-hour timelag fuels contribute most to fire behavior the priority was to match the 1-hour dead fuel moistures to the initial conditions. The 10-hour and 100-hour dead fuel moistures tend to be a little different from the initial conditions.
The conditioning weather stream is selected geographically based on:
- Identifying the center of the landscape extent.
- Calculating the distance from the center to the nearest Remote Automated Weather Station (RAWS) using a horizontal/vertical (elevation) algorithm.
- Ranking the stations and selecting the station which is the “closest” and has weather data requisite for running the model.
- Using the Extreme .wxs for the pyrome which contains the selected RAWS.
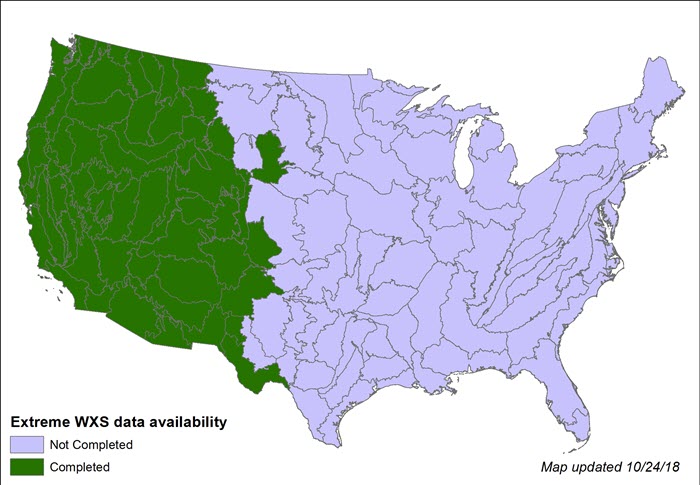
Not all locations will have Extreme .wxs data available. This is because:
- The data is limited to the conterminous United States.
- The weather stream data is under development.
- Some pyromes cannot condition to the leaf-off canopy cover for the 97th percentile ERCs.
- Significant non-burnable areas within pyromes negate the need for fire behavior modeling.
Outputs
Outputs are available as Map Studio layers, summary reports, and downloadable GeoTIFF files.
Landscape Outputs
| Band # | Band Name | Units - GeoTIFF | Units - IFTDSS (Reports) |
|---|---|---|---|
| 1 | Elevation | meters | feet |
| 2 | Slope | degrees | degrees |
| 3 | Aspect | degrees | degrees |
| 4 | Fuel Model | categorical | categorical |
| 5 | Canopy Cover | % | % |
| 6 | Stand Height | meters * 10 | meters |
| 7 | Canopy Base Height | meters * 10 | meters |
| 8 | Canopy Bulk Density | kg/m3 * 100 | kg/m3 |
| 9 | EVT (Existing Vegetation Type) | categorical | N/A |
| 10 | EVC (Existing Vegetation Cover) | categorical | N/A |
| 11 | EVH (Existing Vegetation Height) | categorical | N/A |
| 12 | Zone (LANDFIRE Map Zone) | categorical | N/A |
Auto97th Fire Behavior Outputs
| Band # | Band Name | Units - GeoTIFF | Units - IFTDSS (Report) |
|---|---|---|---|
| 1 | Flame Length | meters | feet |
| 2 | Rate of Spread | meters/min | chains/hr |
| 3 | Fireline Intensity | kW/m | BTU/ft-sec |
| 4 | Heat per Unit Area | kJ/m2 | BTU/ft2 |
| 5 | Crown Fire Activity | class | class |
| 6 | Midflame Wind Speed | mph | N/A |
| 7 | Horizontal Movement Rate | meters/min | N/A |
| 8 | Maximum Spread Direction | degrees | degrees |
| 9 | Maximum Spot Direction | degrees | N/A |
| 10 | Maximum Spot Distance | meters | N/A |
| 11 | Crown Fraction BurnedA | proportion | N/A |
| 12 | 20 Ft Wind Direction B | degrees | N/A |
| 13 | 20 Ft Wind Speed | mph | N/A |
| 14 | Solar Radiation | W/m2 | N/A |
| 15 | 1-hr Fuel Moisture A | proportion | N/A |
| 16 | 10-hr Fuel Moisture A | proportion | N/A |
| 17 | 100-hr Fuel Moisture A | proportion | N/A |
| 18 | 1000-hr Fuel Moisture A,C | proportion | N/A |
A GeoTIFF values for non-burnable pixels are 0.000000 unless the GeoTIFF download was request prior to 6/24/19.
B If Uphill or Downhill wind direction was selected during the model run, the wind direction will be displayed on the GeoTIFF raster grid as -1 for uphill winds, -2 for downhill winds.
C 1000 Hour fuel moisture will always be equal to 100 Hour fuel moisture in the GeoTIFF download.