Quantitative Wildfire Risk Assessment (QWRA) Tutorial
Tip: To run a QWRA you must have run LBP, Mapped Values, and Exposure Analysis. See the QWRA overview topic for details on this workflow.
Running a Quantitative Wildfire Risk Assessment (QWRA) creates a map of potential benefits and threats from fire represented by Conditional weighted Net Value Change (NVC) and Expected weighted NVC for each pixel on the landscape. You may populate the Response Function and Relative Important inputs directly in the IFTDSS interface, as described below, or populate and upload a .CSV file for those inputs (described in the .CSV upload topic).
-
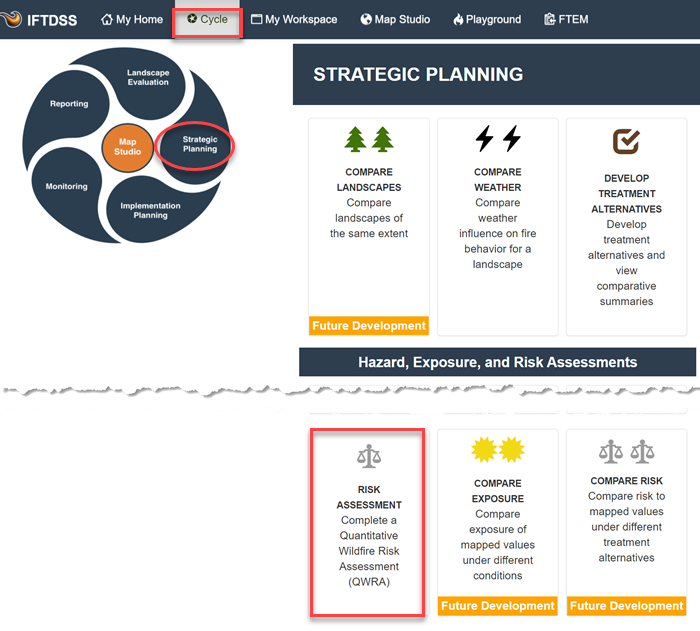
Go to the QWRA interface from the IFTDSS Planning Cycle by clicking on Strategic Planning and Selecting Risk Assessment.
-
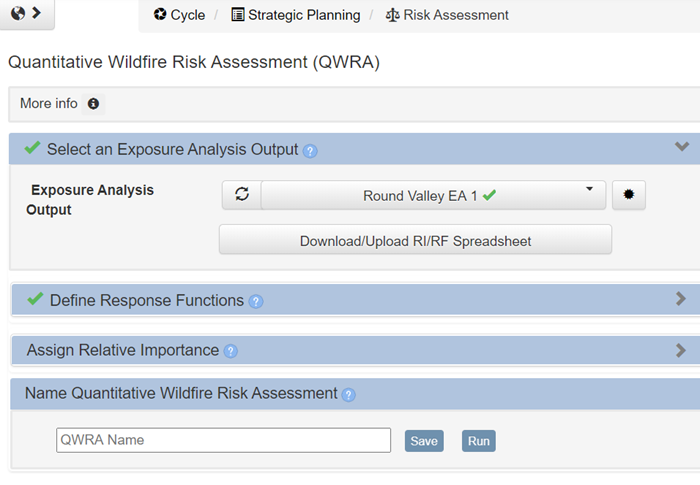
Select an Exposure Analysis output from the drop-down menu. If you need to create one, you may navigate to that part of IFTDSS by clicking the
 Exposure Analysis button to the right of the drop-down menu.
-
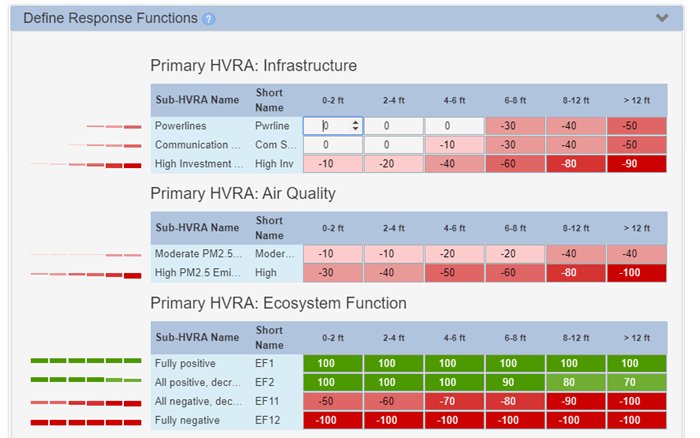
Define response functions (RFs). If you used
 National HVRAs when you mapped your values, the response functions are pre-populated. These values can still be edited. Response functions range from –100 (indicating strong loss) to 100 (indicating strong benefit) for each of these six modeled flame length categories.
Tip: An alternative to filling in response function and relative importance is uploading these as a .CSV. Instructions for populating the .CSV and importing it are outlined here.
-
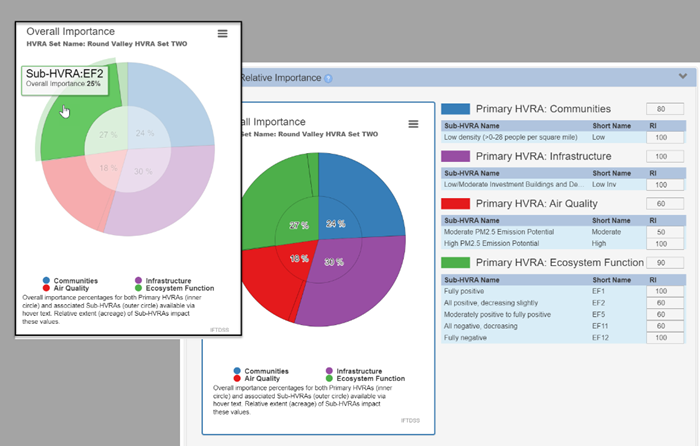
Assign relative importance (RI) to each Primary HVRA and Sub HVRA. Follow these guidelines to populate RIs:
- Primary HVRAs: At least one Primary Category must be assigned a value of 100; more than one can be assigned 100. A value of 100 represents the highest priority resource.
- Sub-HVRAs: At least one Sub-HVRA within each Primary Category must be assigned a value of 100; more than one can be assigned 100. A value of 100 represents the highest priority within that category.
- Once populated you may review your selections using the dynamic pie chart which calculates over-all importance percentages for both Primary HVRAs (inner circle) and associated Sub-HVRAs (outer circle). Hovering over a portion of the circle will pop up with an overall importance value which takes into account the RF, RI, and Relative extent (acreage) of Sub-HVRAs.
-
Name your output and click Run, or Save to return to run it later.

Important! Remember as each model input (RF, RI, etc.) is completed a green checkmark displays to the left of the header.

If you are unable to use the Save or Run options, it’s a good idea to check your inputs to ensure that all have been populated.
Important! A maximum of three Quantitative Wildfire Risk Assessments may be submitted at any given time. If you see a pop-up notifying you that this number has been exceeded, please save any inputs you’ve entered and complete your task when one of the other analyses has completed.
-
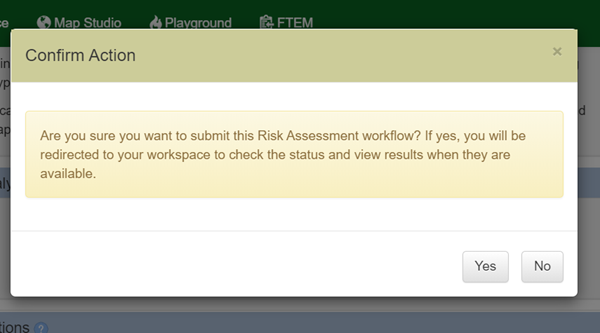
Once you click Run you will be asked to confirm your inputs. Clicking Yes redirects you to the My Workspace folder where your run is stored. There are options to view the run in Map Studio, generate a summary report, or download the QWRA to your local computer.
Important! The Update button replaces the Save button if you begin to edit a saved QWRA. Update saves your new changes and overwrites your previous inputs.
Tip: Pie charts only show up in full screen mode. If you are viewing in split screen mode, use the full screen  button switch back to full screen mode.

