Summarize and Assess the Landscape
Displaying and Assessing the Landscape
Start assessing the landscape in Map Studio:
-
Use the Landscape Tools widget
 to select the landscape under the "Add to Map" tab. This adds the landscape to the map and the map's Layer List. Close the Landscape Tools widget.
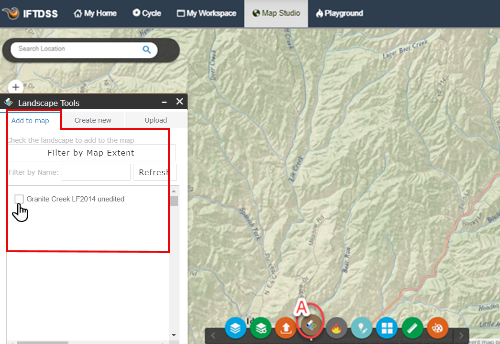
-
Open the Layer List widget
 , ensure your landscape is checked, and view the landscape layers by clicking the dropdown arrow to the left of the checkbox. You can select and unselect the landscape layers to view. View the legend for each layer by clicking the dropdown arrow to the left of the checkbox for that layer.
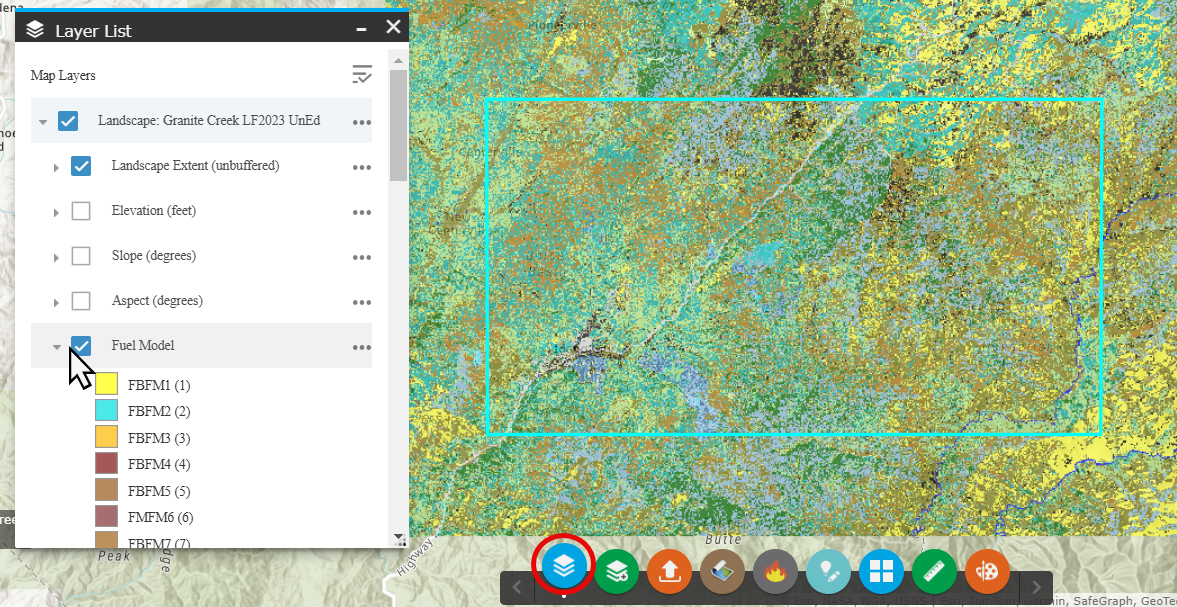
- You'll want to look at the fuel models to make sure they correspond to what your seeing on the ground in this area, so ensure the fuel model box is selected.
-
Click the Identify widget
 in the upper right corner of the page to view more information for different areas of the landscape. Clicking on a pixel displays the information for the pixel. For example, by clicking on areas of the landscape you can see that the green-blue pixels on the map correspond to areas of Fuel Model 188 (TL8). Continue examining various areas of interest on the landscape to learn more about what fuel models are present and where. Notice that all of the landscape characteristics come up in the Identify box when you click on the landscape.
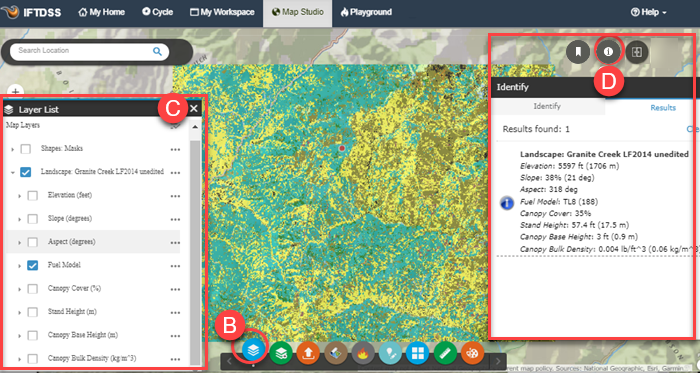
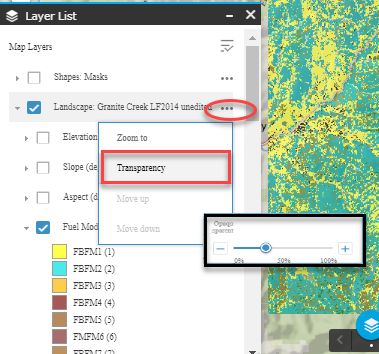
Adjust Transparency
It may be helpful to adjust the transparency of the layer to better see roads, landscape characteristics, or other features. To do this, click More Options to the right of the landscape name in Layer List. In the dropdown menu of options, choose Transparency to open a slider bar allowing you to adjust the transparency level for that layer. Once satisfied with the level of transparency, use the Close button in the bottom right of Transparency window to close it.
Adding Reference Layers
Before doing a full assessment of the landscape characteristics, you’ll want to view previous fires or treatments that may have occurred in this area:
- Click the Add Layers widget
 at the bottom of the screen, and make sure the IFTDSS Reference Layers tab is selected. There are options for several data layers including historic disturbances and treatments, ownership, fire environment, and others.
 - In this example we'll turn on the following reference layers for a better understanding of the area history and infrastructure:
Disturbance History - Fuel Treatments (selecting disturbances spanning from 2020 to 2024).
Disturbance History - WFIGS Wildfire Perimeters (selecting perimeters from 2020 to 2024).
Disturbance History - Interagency Wildfire Perimeters (selecting disturbances spanning from 2010 to 2024).
Infrastructure - Facilities (selecting USFS Buildings and USFS Campsites).
This provides with disturbances that may have occurred after 2023 landscape data (up to the time of this tutorial writing in 2024). If we had more recent disturbances we could display those as well. We also included some older fire perimeters for a reminder of the older disturbances that occurred on this landscape.
-
As each layer is turned on, it appears in the Layer List widget
. Looking at the area we see Idaho City in the southwest; the area surrounding the town has been the focus of several recent fuel treatments. There are fire scars in the north and east of our landscape boundary. Running through the center of the landscape is a road along which campgrounds and some USFS buildings are located. Most of the basin east of the road is not showing recent treatments or fire scars. The Identify widget can be used on any of these layers to provide specific details.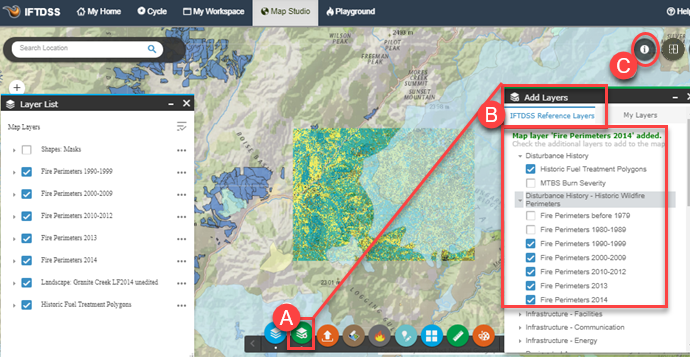
After doing an assessment of all the landscape characteristics (Elevation, Slope, Aspect, Canopy Cover, Stand Height, Canopy Base Height and Canopy Bulk Density) you determine that the LANDFIRE 2023 data in this landscape reflects existing conditions, including previous fire and treatments. If there had been a more recent disturbance since this 2023 data was produced, such as a fire or fuels treatment, it could be easy represented by creating a polygon using the Create/Edit Shapes widget ![]() to reflect the disturbance area, then using the Landscape Editing task in the Planning Cycle to make changes to that area and save them.
to reflect the disturbance area, then using the Landscape Editing task in the Planning Cycle to make changes to that area and save them.
Next, run a summary report and compare these fuel models with potential landscape fire behavior.
Summarizing the Landscape
Creating a Automatic 97th Percentile Landscape Fire Behavior (Auto97th) Report, runs basic fire behavior across the landscape for 97th percentile weather conditions. The results are available as a downloadable report and the model outputs may be views in Map Studio. To create these:
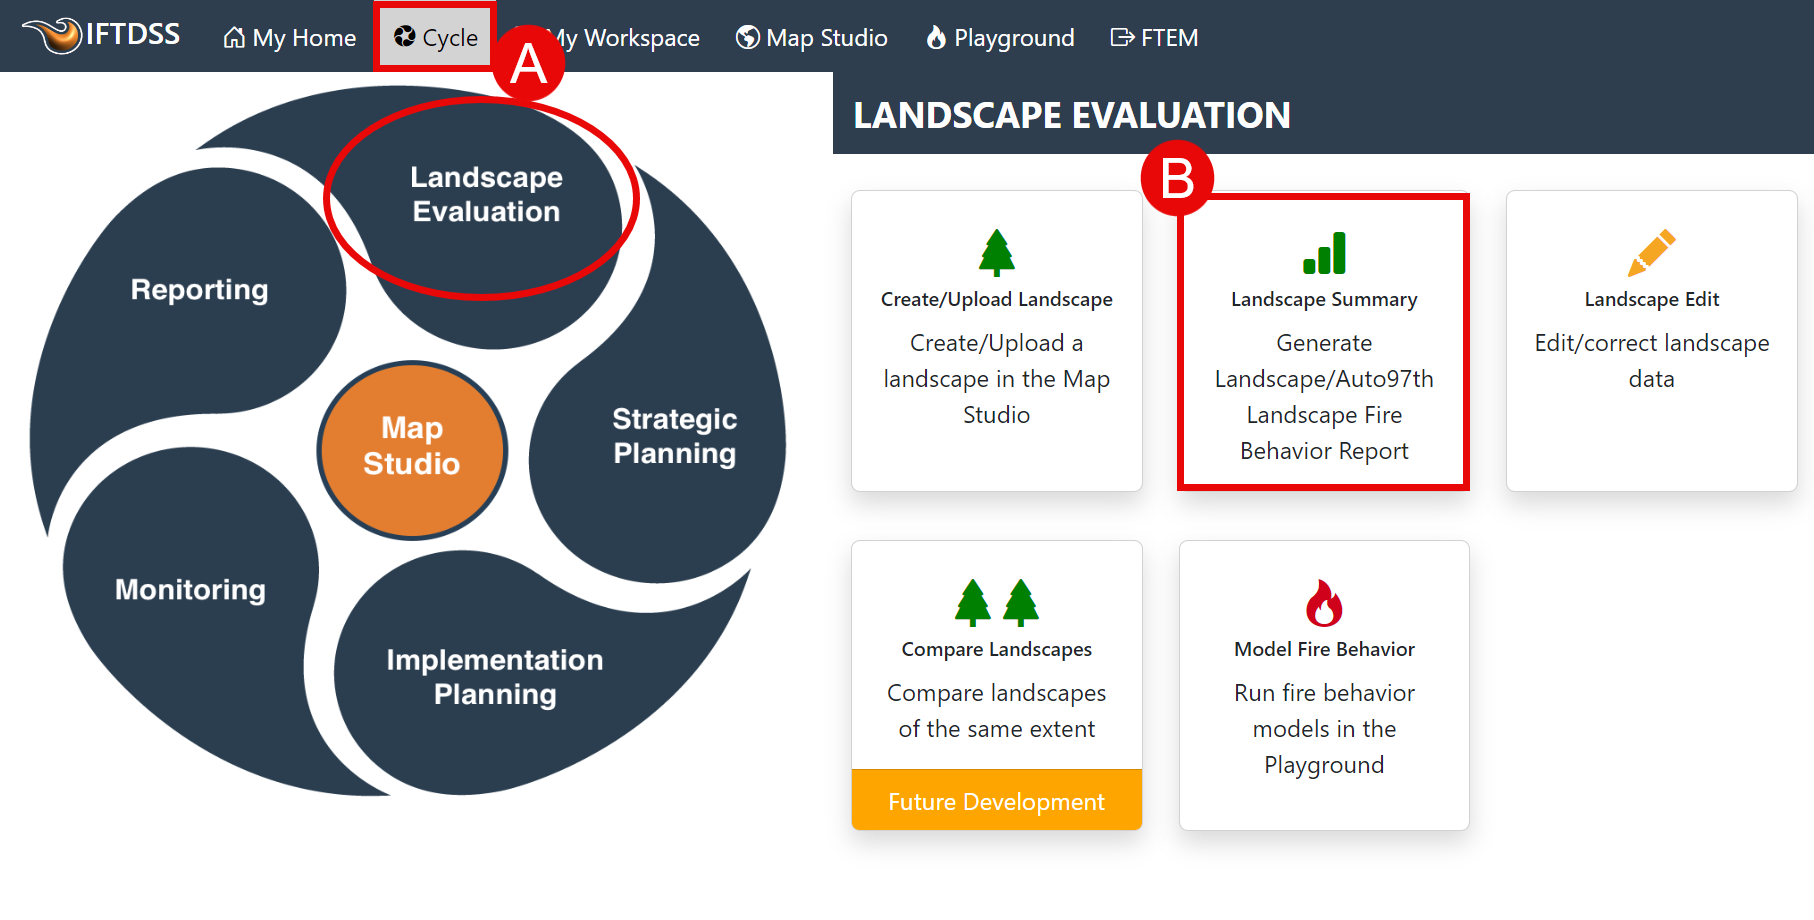
- Click on Cycle in the top navigation.
-
Ensure the Landscape Evaluation stage is selected, then click the Landscape Summary task.
- In Landscape Summary, click the dropdown menu next to Starting Landscape. If the newly created landscape doesn’t appear in the dropdown, use the Refresh button
 after giving the landscape a short time to process. The landscape appears with a green check next to it which indicates it has been successfully created and may now be used throughout IFTDSS. If you wanted to create a report just for an area of interest, you'd use the Area of Interest dropdown menu to select a shape or shapefile. For this example, leave the Area of Interest field blank in order to produce a report for the entire landscape.
 -
Click Create Report.
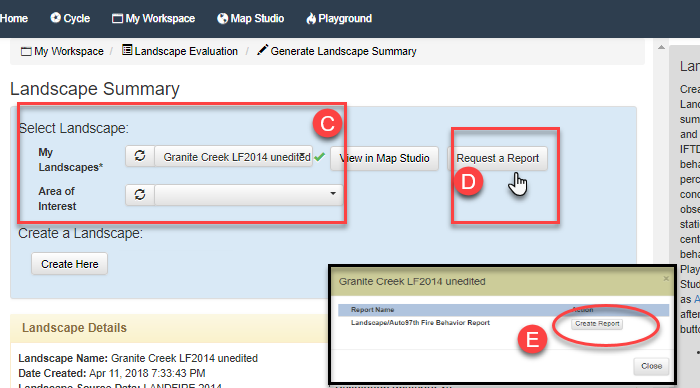
-
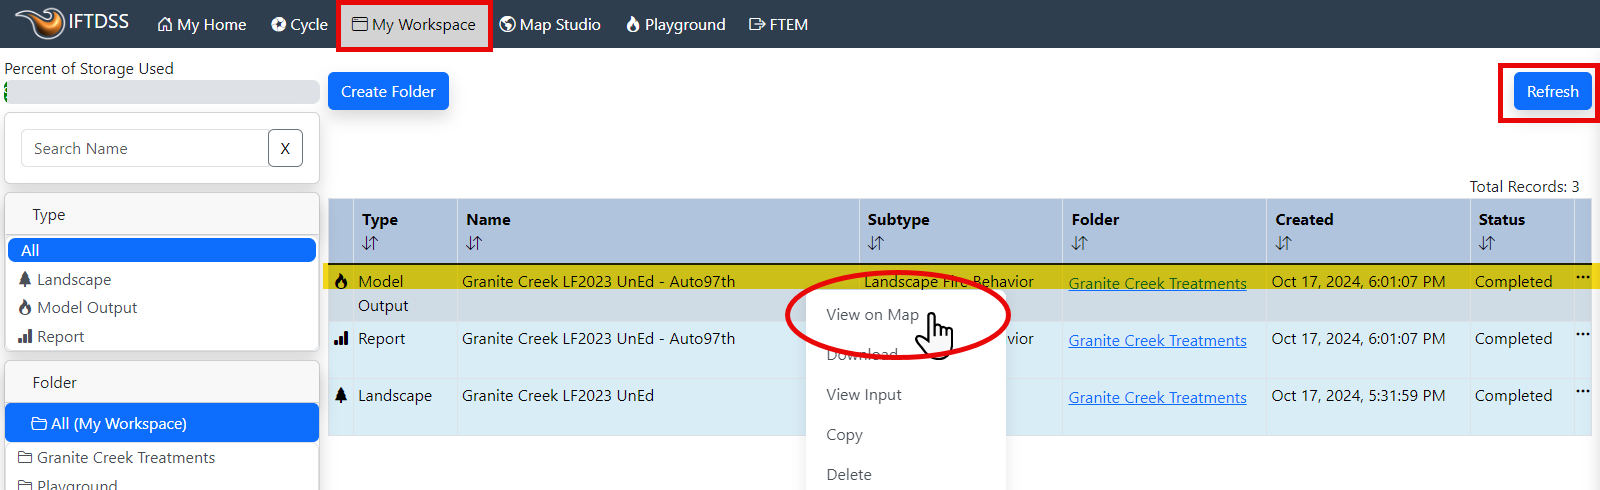
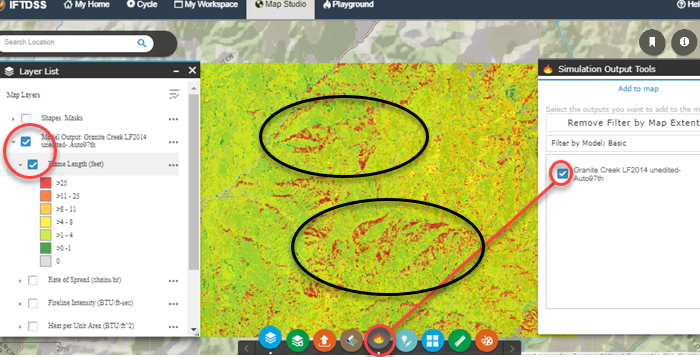
The modeling and report process will begin running. During this time, we can navigate to My Workspace and use the Refresh button to see when the model and report have completed. When completed, right click on the model output, "Granite Creek LF2023 UnEd - Auto97th", to view the file options. Select "View on Map," this will open the model outputs in Map Studio.
Note: Model outputs are stored in the same folder as the landscape file they were created from. In this case, the "Granite Creek Treatments" folder.
Comparing Landscape Features and Model Outputs with the Swipe widget
Using the widgets in Map Studio we can evaluate the predicted basic fire behavior given 97th percentile fuel moisture conditions on the landscape.
-
On the Layer list, togging between the fire behavior outputs, flame length appears to be the most pronounced in the center of the landscape just east of the road, as well as in the south central part of the landscape. These same areas are also predicted to have greater fireline intensity and more instances of passive crown fire.
-
To compare these model outputs with landscape features, add the Granite Creek LF2023 unedited landscape back to Map Studio by opening the Landscape Tools widget
, clicking the Add to Map tab and using the checkbox to add the "Granite Creek LF2023 UnEd." Close the Landscape Tools widget.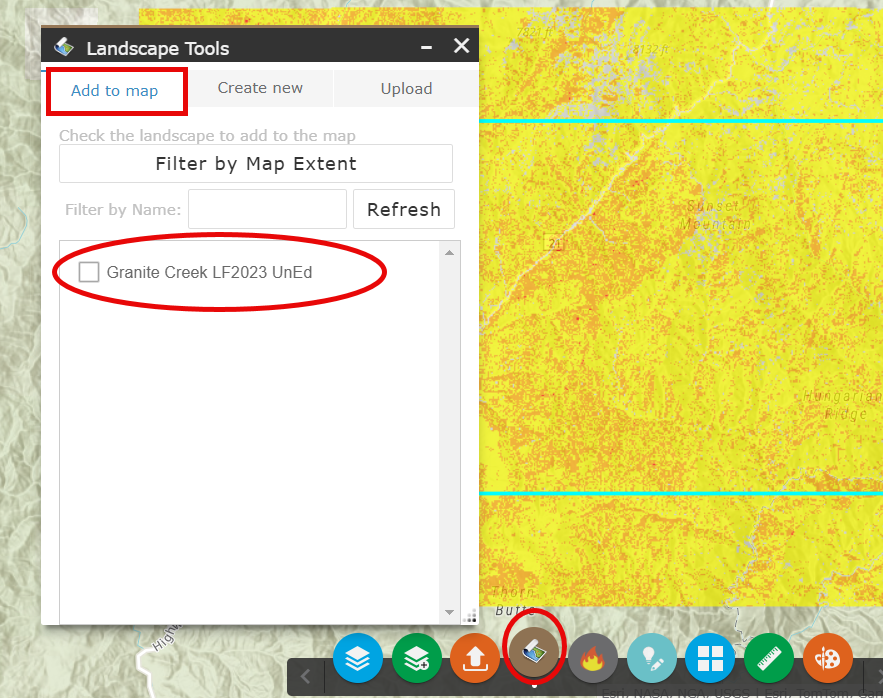
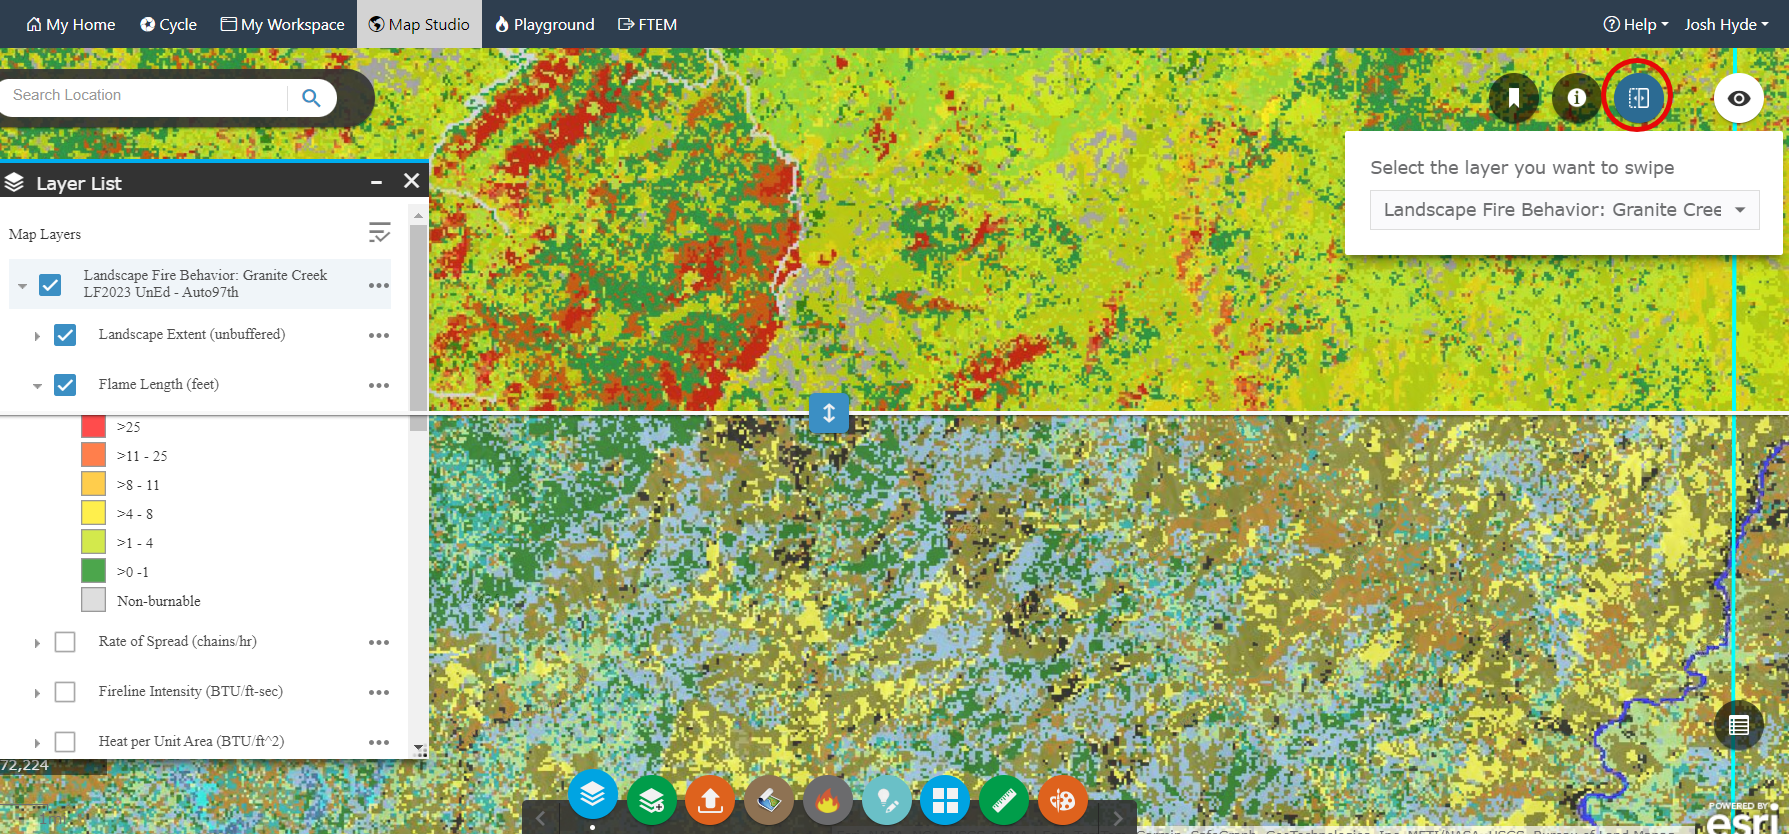
- Click the Swipe widget
 in the top right of Map Studio. In the Leading Layer (Top) option of swipe, select the Fuel Model feature of the Granite Creek LF2023 landscape. In the Trailing Layers (Bottom) option of swipe, select the Flame Length feature of the Landscape Fire Behavior layer. Swiping back and forth between the fire behavior layer and the landscape, as well as using the Identify widget
  , it becomes easier to see some trends in these areas of high fire behavior such as higher flame lengths typically predicted on:
- Areas with TU5, TL8 or TU3 fire behavior fuel models.
- North or northwest facing aspects.
With this information, you decide to create two areas of interest, or areas on which you’d like to focus the analysis and treatments.