Developing Treatment Alternatives - Colville National Forest Example
Section 2- Summarize and Assess the Landscape
Displaying and Assessing the Landscape
Start assessing the landscape in Map Studio:
-
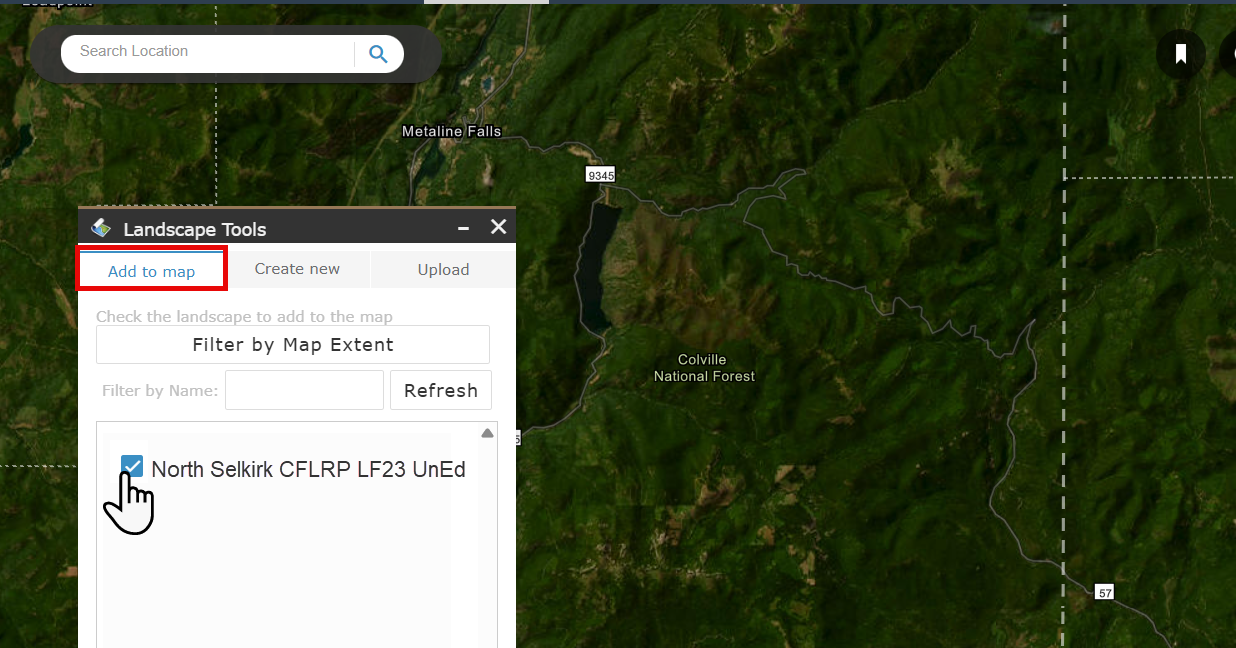
Use the Landscape Tools widget
 to check the landscape under the “Add to Map” tab. This adds the landscape to the map and the map’s Layer List widget
 .
.
- Open the Layer List widget, ensure your landscape is checked, and view the landscape layers by clicking the dropdown arrow to the left of the checkbox. You can check and uncheck the landscape layers to view. You’ll want to look at the fuel models to make sure they correspond to what you’re seeing on the ground in this area, so ensure the box is checked.
- View the legend for each layer by clicking the dropdown arrow to the left of the checkbox for that layer. In this case, check the box next to “Fuel Models”, then click on the arrow to the left of the checkbox to dropdown to the Fuel Model layer legend.
-
Click the Identify widget
 in the upper right corner of the page to view more information for each pixel. Select the layer to view (North Selkirk CFLRP LF23 UnEd), then click on the landscape in an area you’d like to know more about. The Identify dialogue populates with the landscape information for this pixel. For example, by clicking you can see that the dark green pixels on the map correspond to areas of Fuel Model 165 (TU5). Continue examining various areas of interest on the landscape to learn more about what fuel-models are present and where. Notice that all of the landscape characteristics come up in the identify box when you click on the landscape with the Identify widget, not just the characteristic you specified in the Layer List widget.
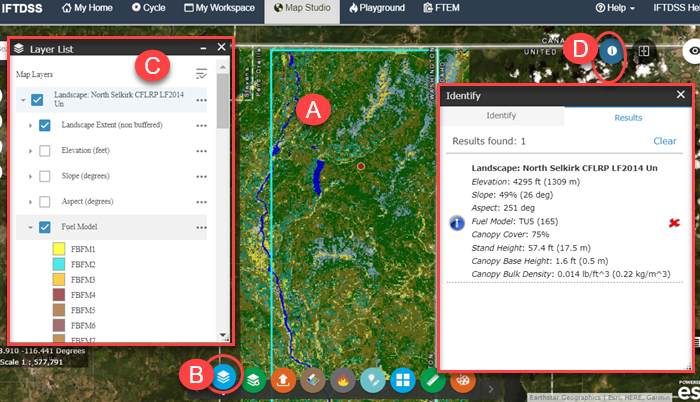
Adjust Transparency
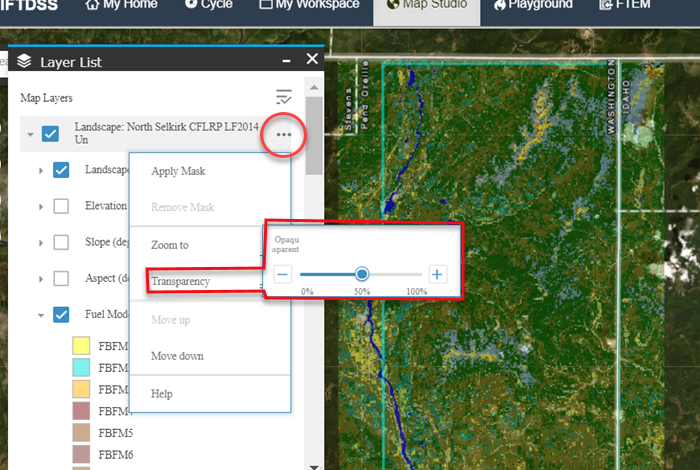
It may be helpful to adjust the transparency of the layer to better see roads, landscape characteristics, and other map features. To do this, clickMore Options to the right of the Landscape name in Layer List
![]() . A dropdown menu of options opens. Choose Transparency, which opens a dialogue box with a slider bar allowing you to adjust the transparency level for that layer. Once satisfied with the level of transparency, close the slider bar using the close button.
. A dropdown menu of options opens. Choose Transparency, which opens a dialogue box with a slider bar allowing you to adjust the transparency level for that layer. Once satisfied with the level of transparency, close the slider bar using the close button.
Adding Reference Layers
Before doing a full assessment of the landscape characteristics, you’ll want to view previous fires that may have occurred in this area:
- Click the Add Layers widget
 at the bottom of the screen and make sure the “IFTDSS Reference Layers” tab is selected. You’ll notice there are many options for additional data layers, including “Ownership” and “Critical Habitat Areas”.
 -
For now, focus on disturbance history. Click the dropdown arrow next to “Disturbance History - Fuels Treatments” and select historic fuel Treatments from 2020 to the present. Next, expand the dropdown for “Disturbance History-WFIGS Wildfire Perimeters" and "Interagency Wildfire Perimeters”, and select the perimeters for years 2020 through “Fire Perimeters Year to Date.” These appear in the Layer List widget and on the map.
-
Use the Identify widget
to identify the exact year of some of the fires in the historic wildfires perimeters layers. Click the applicable Fire Perimeter layers on and off to compare the landscape and fuel models underneath. In this example, you see they are reflective of these fires.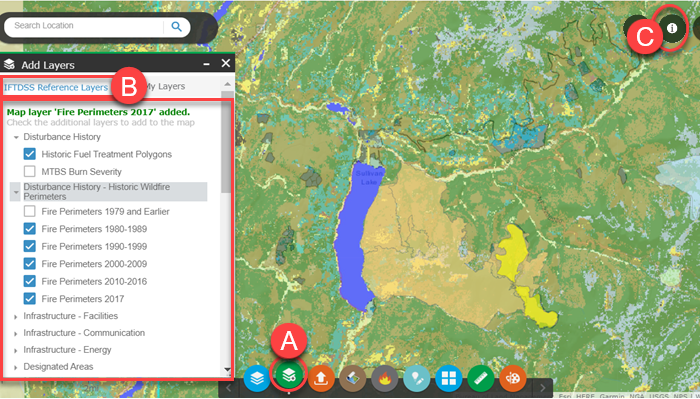
Follow this same process with the Historic Fuel Treatment Polygons layer as well.
After doing an assessment of all the landscape characteristics (Elevation, Slope, Aspect, Canopy Cover, Stand Height, Canopy Base Height and Canopy Bulk Density), you determine that the LANDFIRE 2023 data in this landscape reflects existing conditions, including previous fires. If there had been a more recent disturbance since this 2023 data was produced, such as a fire or fuels treatment that you would want to represent on this landscape, it could be easily represented by creating a polygon using the Create/Edit Shapes widget![]() to reflect the disturbance area, then using the Landscape Editing task in the Planning cycle to make changes to that area and save them.
to reflect the disturbance area, then using the Landscape Editing task in the Planning cycle to make changes to that area and save them.
Next, run a summary report and compare these fuel models with potential landscape fire behavior.
Summarizing the Landscape
Creating an Automatic 97th Percentile Landscape Fire Behavior (Auto97th) Report, makes the outputs available in Map Studio and summarizes behavior and landscape features in a downloadable report with tables and charts. It also creates a model output layer that can be viewed in Map Studio. To create these:
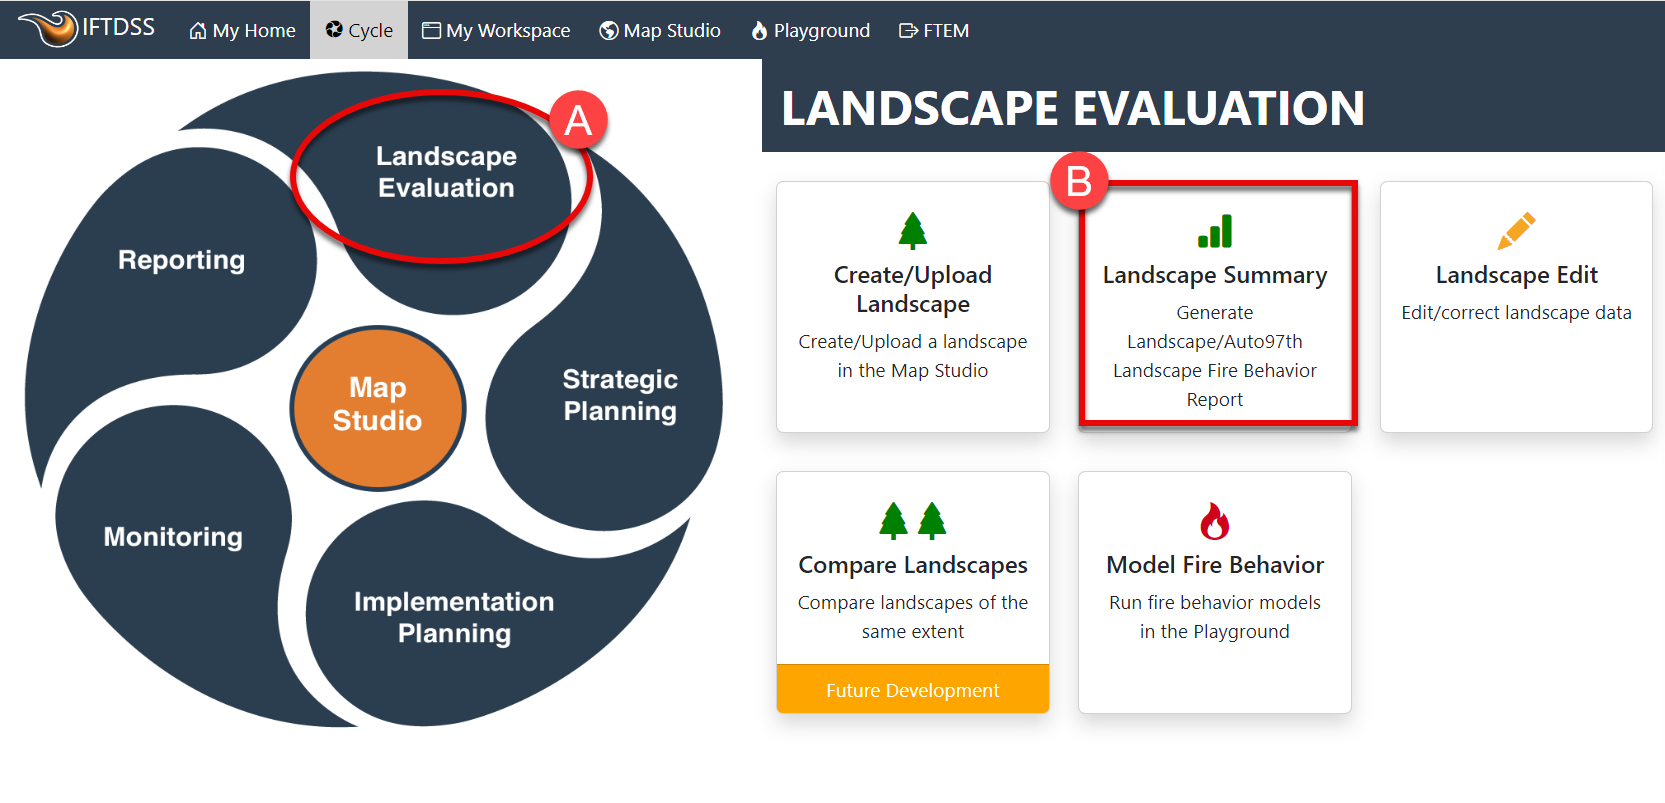
- Click on Planning Cycle in the top navigation.
-
The cycle opens on the Landscape Evaluation stage by default, from there click the Landscape Summary task.
-
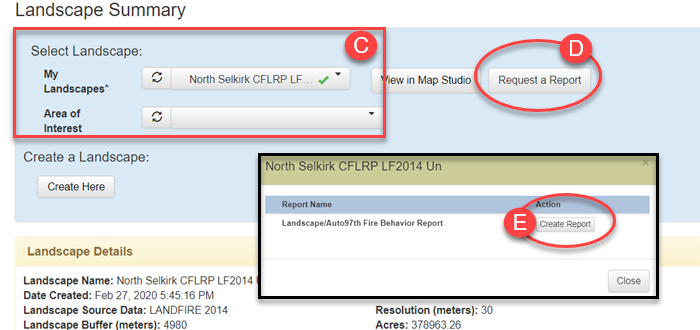
In Landscape Summary, click the dropdown menu next to Select Landscapes. If the newly created landscape doesn’t appear in the dropdown, use the Refresh button after giving the landscape a short time to process. The landscape appears with a green check next to it (which indicates it has downloaded completely to your IFTDSS account).
- Click Create Report.
-
If you wanted to create a report just for an Area of Interest, you’d use the Area of Interest dropdown menu to select a shape or shapefile. For this example, leave Area of Interest blank in order to produce a report for the entire landscape. Click Create Report in the bottom right of the box. The report begins processing and may take a few minutes.
-
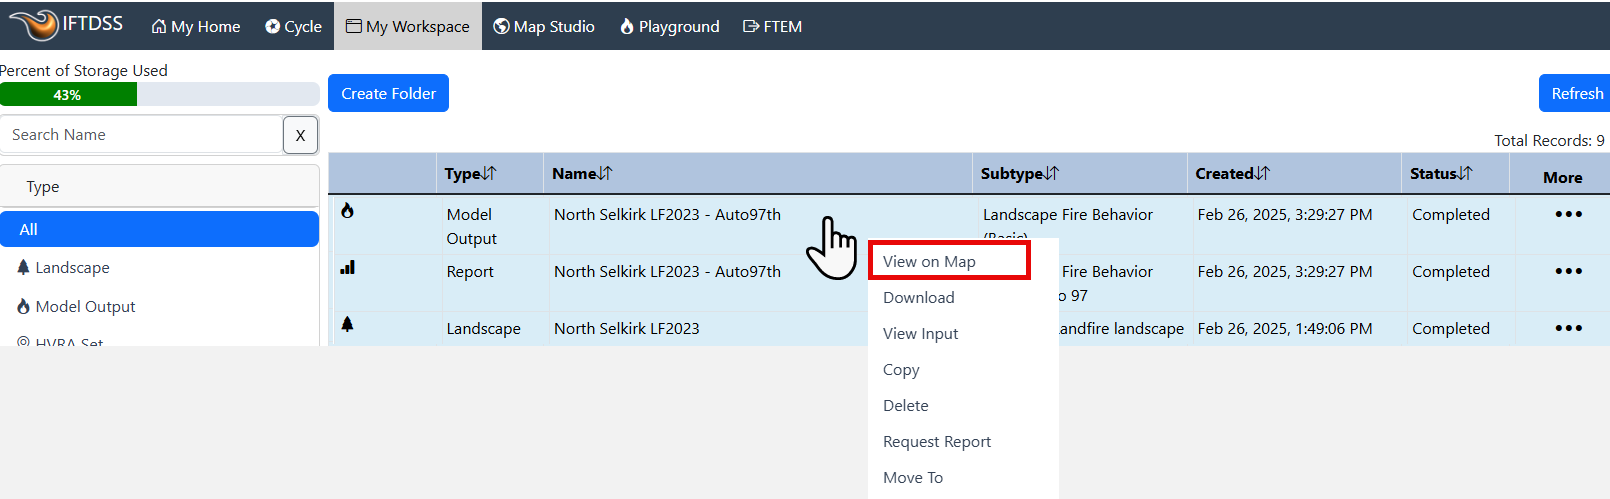
Navigate to My Workspace. Notice a landscape fire behavior (Basic) model has completed, as has a report. Right-click the model output and select View on Map.
Comparing Landscape Features and Model Outputs with the Swipe Widget
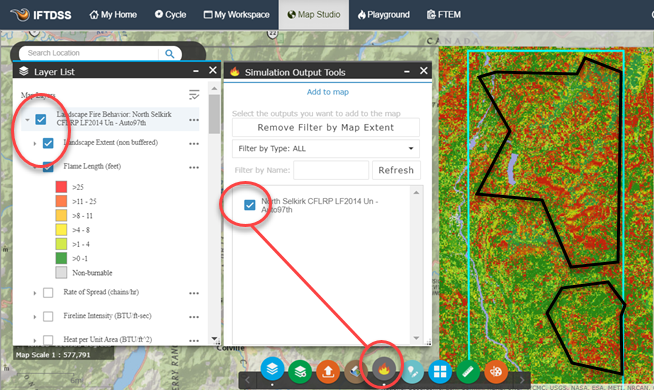
After clicking View in Map Studio, the fire behavior model layer will automatically open. For future use, you can remove or add other modeling layer to Map Studio by clicking the Simulation Output Tools![]() widget on the bottom of the screen and checking or unchecking the boxes next to each modeling output.
widget on the bottom of the screen and checking or unchecking the boxes next to each modeling output.
- If the layer did not automatically open, click the Simulation Output Tools
 widget on the bottom of the screen.
 -
Ensure the box next to “North Selkirk CFLRP LF23 UnEd - Auto97th” is checked so this layer opens on the map and is visible in Layer List
. Check the appropriate boxes in Layer List to view Flame Lengths and the corresponding legend as displayed below.Zoom into an orange/red area where you can see concentrated areas high Flame Lengths projected by the model. Next, you’ll look at the fuel models and topography for the area of more intense fire behavior.
-
To compare these model outputs with your landscape, add the North Selkirk CFLRP LF23 UnEd landscape back to Map Studio by opening the Landscape Tools
widget , clicking the Add to Map tab and using the checkbox to add the “North Selkirk CFLRP LF23 UnEd”. Use the dropdown arrows and check-boxes in Layer List to display only the landscape Fuel Model layer and the Model output Flame length layer.Tip: To move a layer group, such as Landscape, up or down in Layer List, click the More Options
button to the right of the layer and choose "Move up" or "Move down."
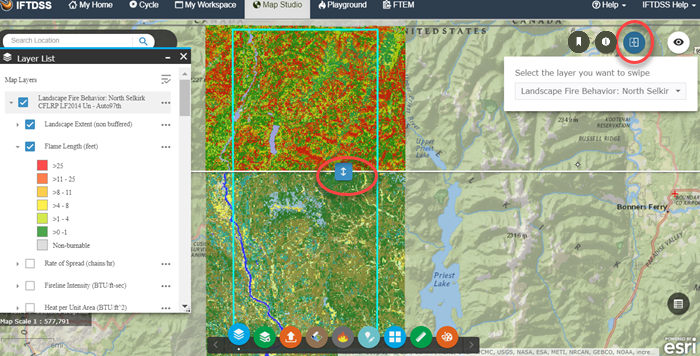
Next you’ll compare the two using Swipe:
- Click the Swipe
 widget in the top right of Map Studio.
 -
Next, specify the layers to swipe. By default, you can see active layers and features in the swipe tool and choose the specific ones to display. In the example below, “Model Output: North Selkirk CFLRP LF23 UnEd - Auto97th” is displayed on the top, and the Landscape layer is displayed on the bottom. Slide the bar in the middle of the screen up and down. Notice the areas with high flame lengths correspond to areas of Fuel Model 165 (TU5) with small patches of 122 (GS2).
Next, you’ll want to view the topography to see how it corresponds to the areas displaying more intense fire behavior. With the Swipe![]() widget still open, move the cursor over to Layer List
widget still open, move the cursor over to Layer List![]() and turn off the Landscape layer. Next, select the Flame Length feature of the Landscape Fire Behavior layer as the Leading Layer (Top) in Swipe. This will show fire behavior in the top, and nothing in the bottom. Open the Basemap Gallery
and turn off the Landscape layer. Next, select the Flame Length feature of the Landscape Fire Behavior layer as the Leading Layer (Top) in Swipe. This will show fire behavior in the top, and nothing in the bottom. Open the Basemap Gallery ![]() widget and turn on the Topographic basemap. This will display only that behavior layer in the top and the topography underneath.
widget and turn on the Topographic basemap. This will display only that behavior layer in the top and the topography underneath.
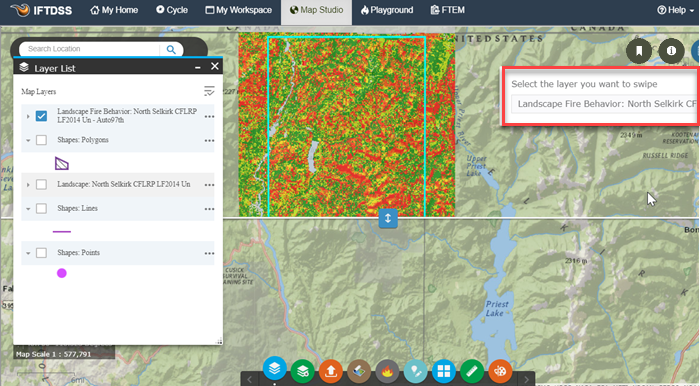
As you swipe up and down, you will notice all the areas displaying more intense fire behavior are south, southeast, and southwest facing slopes. Wrapping up this analysis by repeating this process in the northern part of the landscape, you notice there appears to be several areas that would produce more intense fire behavior. Also compare other aspects of fire behavior, such as Rate of Spread and Crown Fire Activity.
With this information, you decide to create two Areas of Interest, or areas on which you’d like to focus the analysis and treatments.